
Feb, 02, 2026
By Lawrence G. McMillanJoin Larry McMillan as he discusses the current state of the stock market on February 2, 2026.

Feb, 02, 2026
By Lawrence G. McMillanThe January seasonal trade is usually one of our best seasonal trades (right behind the October seasonal). The trade is to buy $SPX at the close of the 18th trading day of the...
Jan, 30, 2026
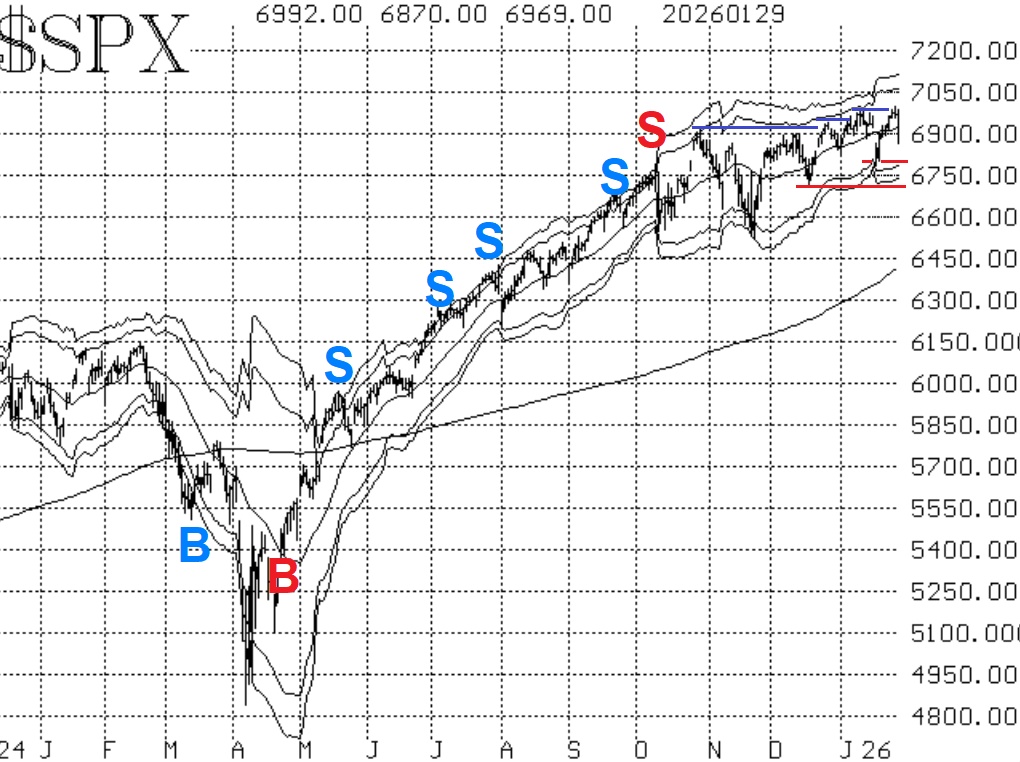
By Lawrence G. McMillanThis week saw $SPX make new all-time highs once again and even cross above 7,000 for the first time in history. Was that enough to generate a clear upside breakout? No!...
Jan, 27, 2026
By Lawrence G. McMillanWe’ve just added a full-length webinar to The Option Strategist Substack: Trading Systems & Other Useful Applications.This session focuses on rules-based trading systems...
Jan, 27, 2026
By Lawrence G. McMillanJoin Larry McMillan as he discusses the current state of the stock market on January 26, 2026.
Jan, 26, 2026
By Lawrence G. McMillanThe put-call ratio is one of the most widely followed indicators in options trading — and one of the most misunderstood. When used correctly, it can provide powerful, contrary...
Jan, 23, 2026
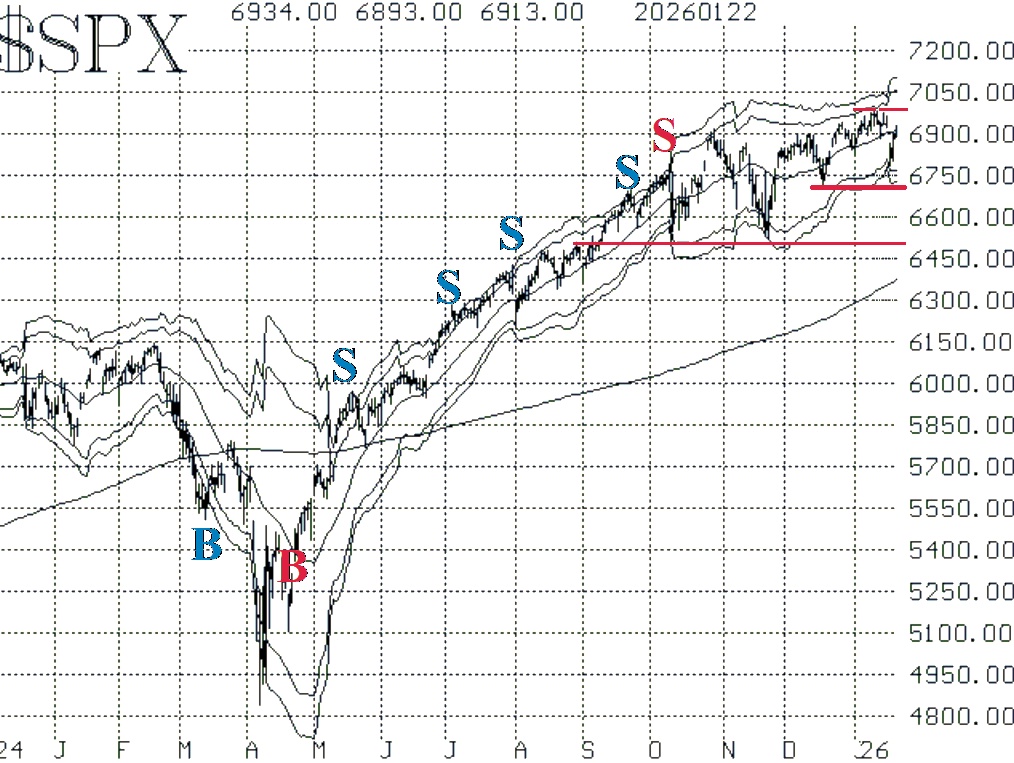
By Lawrence G. McMillanThis past week has seen volatile moves in both directions. First, $SPX failed to capitalize on the move to new highs a week ago, and then over last (3-day) weekend, President...
Jan, 23, 2026
By Lawrence G. McMillanThe impetus for this column came from the fact that the S&P futures took a beating last Monday (January 19th, 2026) on the holiday celebrating Martin Luther King. Of course...
Jan, 20, 2026
By Lawrence G. McMillanJoin Larry McMillan as he discusses the current state of the stock market on January 20, 2026.
Jan, 16, 2026
By Lawrence G. McMillanNow that January is here, the first of two “classic” January indicators is in place. That is the result of the first five trading days of January. Here are the...
Pages
© 2023 The Option Strategist | McMillan Analysis Corporation