By Lawrence G. McMillan
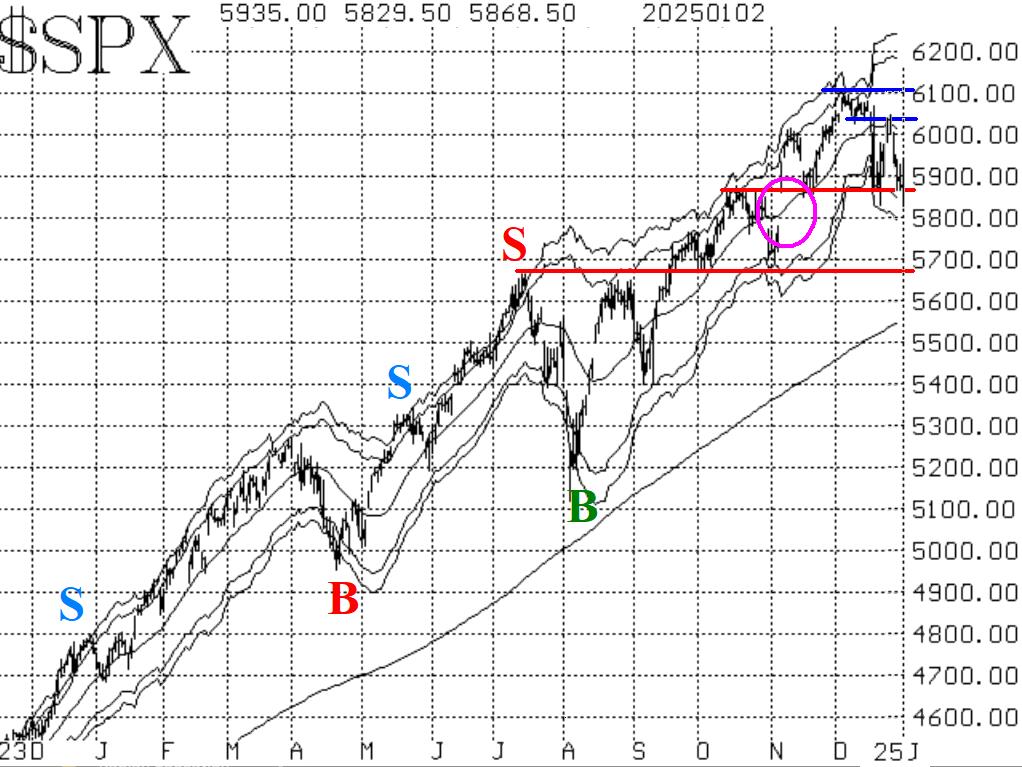
The old year ended with a thud, as stocks sold off pretty sharply over the final three days. In doing so, the closing support level at 5870 held once again. So, that is certainly an even more important area than it was before. As long as $SPX holds above that level, the $SPX chart still has a bullish slant. However, if $SPX closes decisively below 5870, then heavier selling should develop.
There is overhead resistance at 6010 and then at the all-time highs of 6100. A move outside of the 5870-6100 area should see plenty of follow-through momentum. There is also support below. However, the $SPX chart would no longer have a bullish interpretation if it fell so far as to find support at lower levels -- 5780 and 5670.
So, the $SPX chart is still in a bullish mode, but internal indicators are weakening. Market internals have been deteriorating for some time. We have seen similar setups in the past, where the $SPX chart is bullish, but the indicators are negative. Normally, it is the $SPX chart which wins out.
Equity-only put-call ratios have continued to rise since bottoming out in mid-December. They are thus on sell signals. It is bearish for stocks as long as these ratios are rising. The weighted ratio (Figure 3) is rising much more rapidly than the standard ratio (Figure 2). In fact, the standard ratio really hasn't even cleared its way above the previous lows of 2024 on its chart. For that reason, there is still a question mark as to the validity of the sell signal in Figure 2. In any case, these ratios won't generate buy signals until they roll over and begin to decline again.
Breadth has been generally negative for weeks, except for a brief surge of positivity just before Christmas. As a result, the breadth oscillators have been on sell signals for most of that time.
$VIX has risen back up to the 17-18 level, as traders felt a little worried about the market's decline at the end of the year. But the "spike peak" buy signal from December 19th is still in place.
In summary, we are maintaining a "core" bullish position because of the positive nature of the $SPX chart. We will add other confirmed signals around that. To that extent, we are poised to add bearish positions if $SPX fails at support.
This Market Commentary is an abbreviated version of the commentary featured in The Option Strategist Newsletter.
© 2023 The Option Strategist | McMillan Analysis Corporation

