Apr, 03, 2026
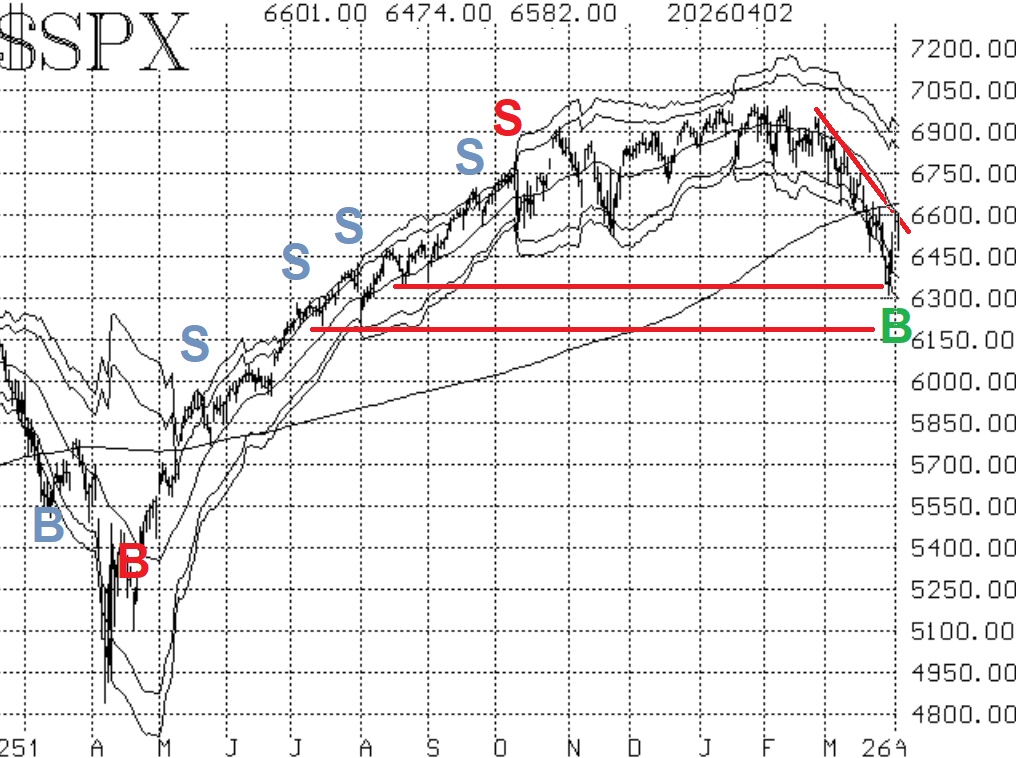
By Lawrence G. McMillanVolatility continues to be elevated both in terms of realized and implied. $SPX dropped sharply early in the week as various support levels gave way on the $SPX chart. Of...
Mar, 31, 2026
By Lawrence G. McMillanThis intensive webinar—originally recorded in December 2012—offers a deep dive into volatility trading and the practical application of option theory. While markets and...

Mar, 30, 2026
By Lawrence G. McMillanJoin Larry McMillan as he discusses the current state of the stock market on March 30, 2026.
Mar, 27, 2026
By Lawrence G. McMillanThe major averages continue to decline, and they are in a seriously bearish mode. Moreover, the pattern of lower highs and lower lows persists, so there is a distinct downtrend...

Mar, 26, 2026
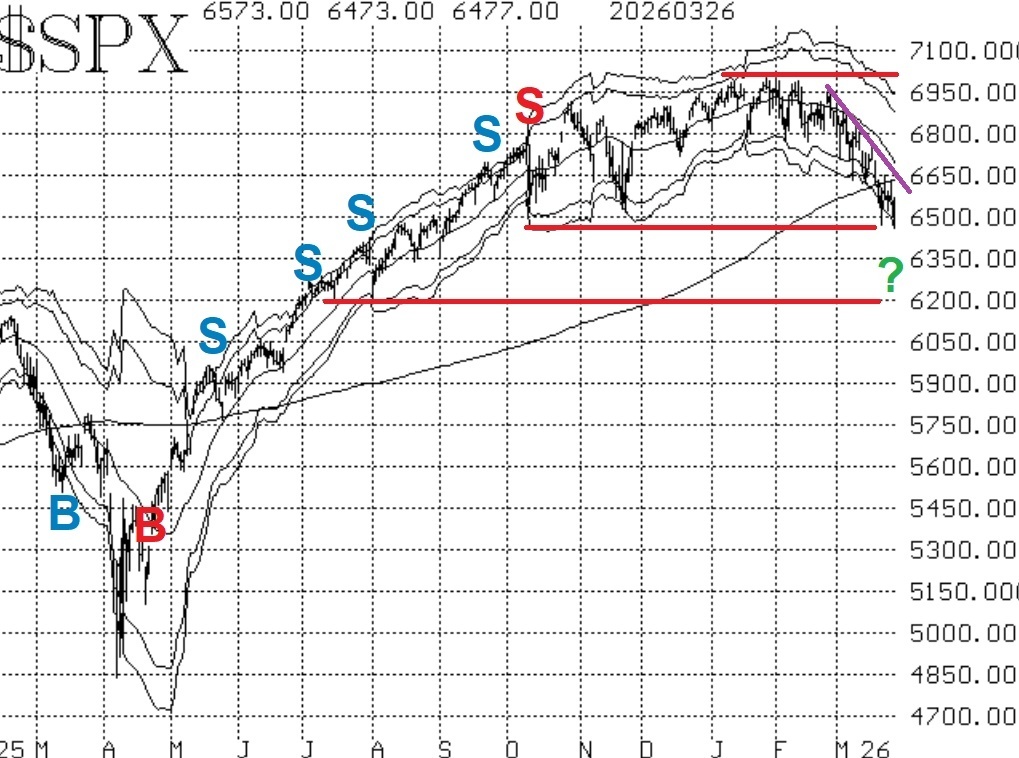
By Lawrence G. McMillanIf you’ve been following the market closely, you’ve likely noticed that conditions have changed.Volatility is rising. Trends are becoming less reliable. And sentiment...
Mar, 23, 2026
By Lawrence G. McMillanJoin Larry McMillan as he discusses the current state of the stock market on March 23, 2026.
Mar, 20, 2026
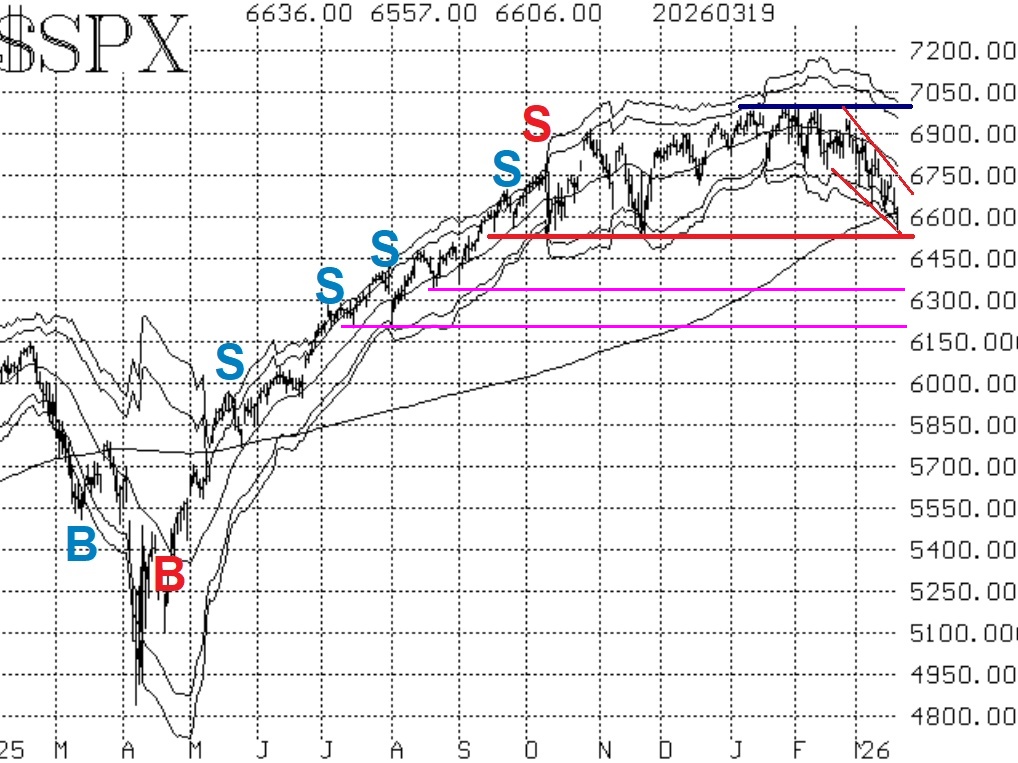
By Lawrence G. McMillanThe downtrend on the $SPX chart is obvious, even to the casual observer. Not only are there now lower highs and lower lows, but the short-term moving averages as well as the "...
Mar, 16, 2026
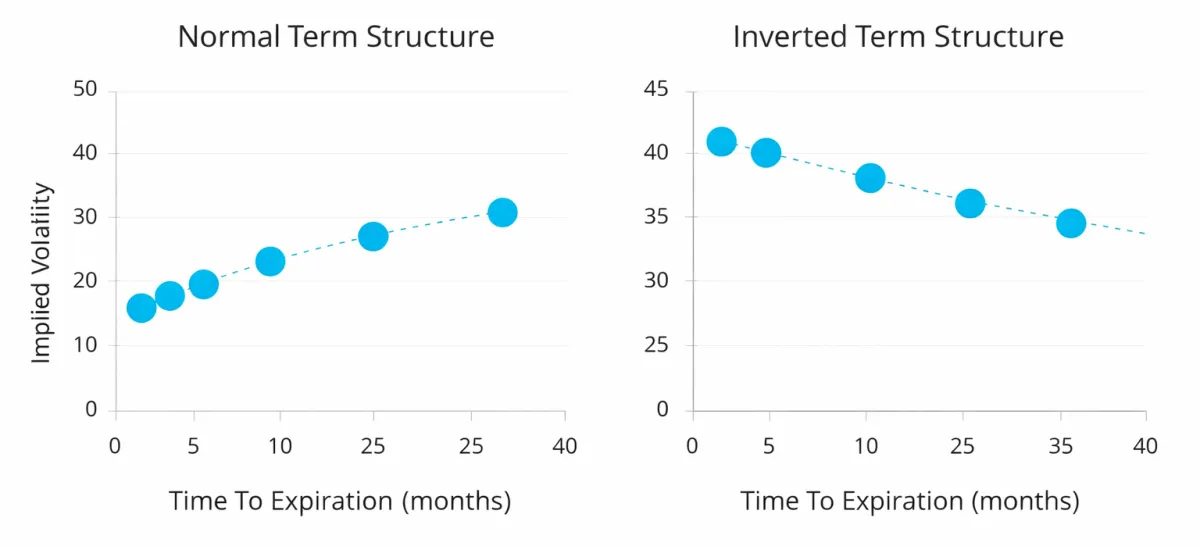
By Lawrence G. McMillanOver the years, we have discussed a lot of volatility-based trades. Since volatility is high now, a number of them are apropos, so for newer and older subscribers alike, this...
Mar, 16, 2026
By Lawrence G. McMillanJoin Larry McMillan as he discusses the current state of the stock market on March 16, 2026.
Mar, 13, 2026
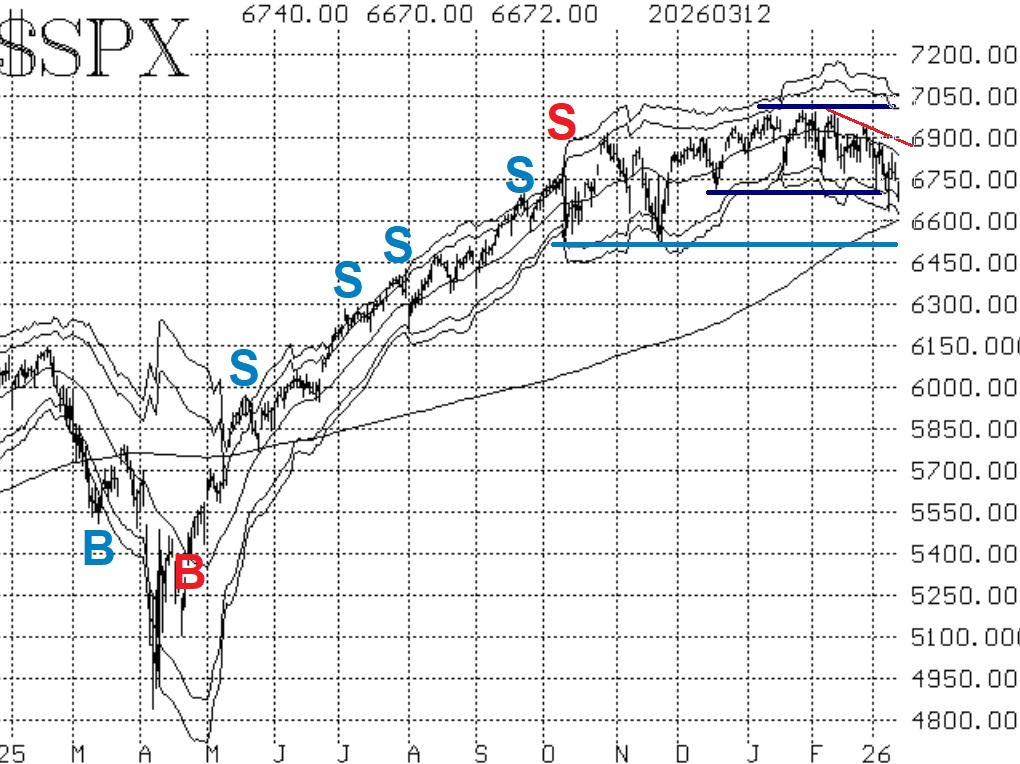
By Lawrence G. McMillanIt certainly took a while, but $SPX has finally closed below its December low of 6720. On average, statistics show a further decline of 10% when that occurs. Sometimes these...
Pages
© 2023 The Option Strategist | McMillan Analysis Corporation