Special Situation Alerts is McMillan Analysis Corp.'s newsletter service designed for the...
The Daily Put-Writer is McMillan Analysis Corp.'s daily newsletter service for the avid put-seller. Delivered each afternoon, The Daily Put...
McMillan’s Probability Calculator is low-priced, easy-to-use software designed to estimate the probabilities...
Professional traders are well aware of the fact that an increase in a stock's option volume is often the precursor of a move by the...
Sign up for The Weekly Updater to receive comprehensive stock market insight each Friday for free. Enter your email address below
One of the questions that traders – both retail and professional – have been asking all throughout the bear market...
Join Larry McMillan as he discusses the current state of the stock market on March 27, 2023.
...As for the $SPX chart, it once again shows a lower high and lower low, since that February top. Moreover, the...
By Lawrence G. McMillan
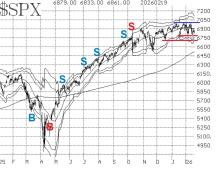
As for the $SPX chart, it once again shows a lower high and lower low, since that February top. Moreover, the latest rally attempt, which began on March 13th, appears to merely be an oversold rally. It sprang from several rather severe oversold conditions, and it has now run into trouble at or just above the declining 20-day Moving Average a "classic" oversold rally.
There is currently resistance at 4040 (this week's high), but the stronger resistance is the entire area between 4080 and 4200 (the trading range from early February), which has already been tested once and held (in early March). Meanwhile, the broad support area from 3760 to 3850 (the...