
Jul, 22, 2026
By Lawrence G. McMillanJoin Larry McMillan as he discusses the current state of the stock market on July 21, 2026.
Jul, 20, 2026
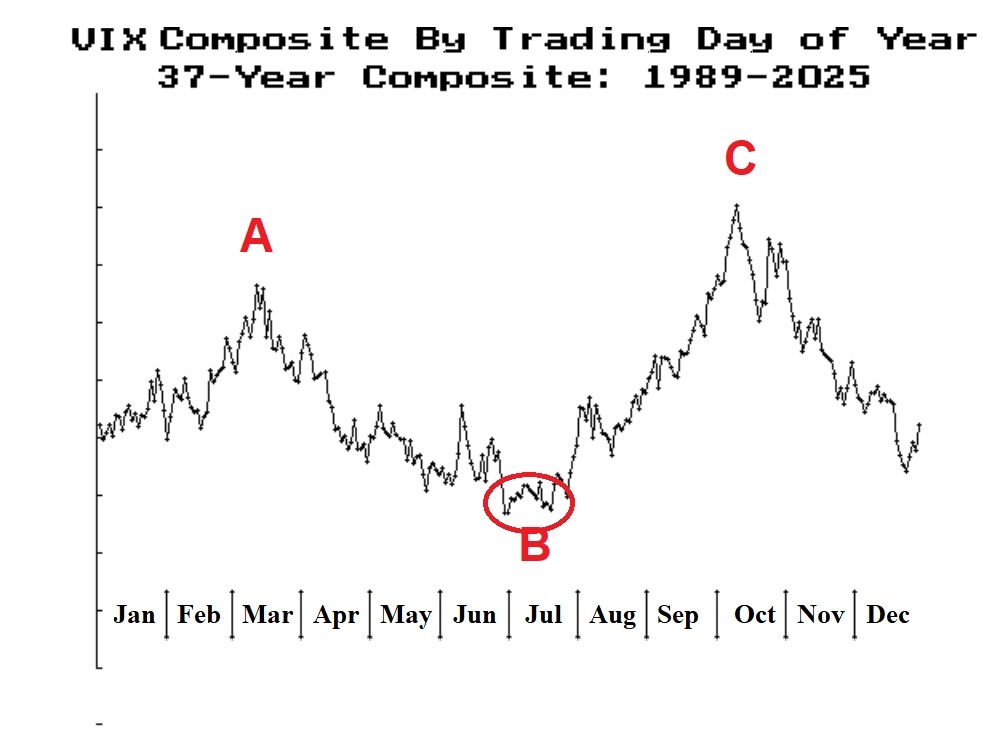
By Lawrence G. McMillanIt is once again time to consider that $VIX may have bottomed for the year. It is a common occurrence for $VIX to make its annual lows in July and then begin to rise in August...
Jul, 17, 2026
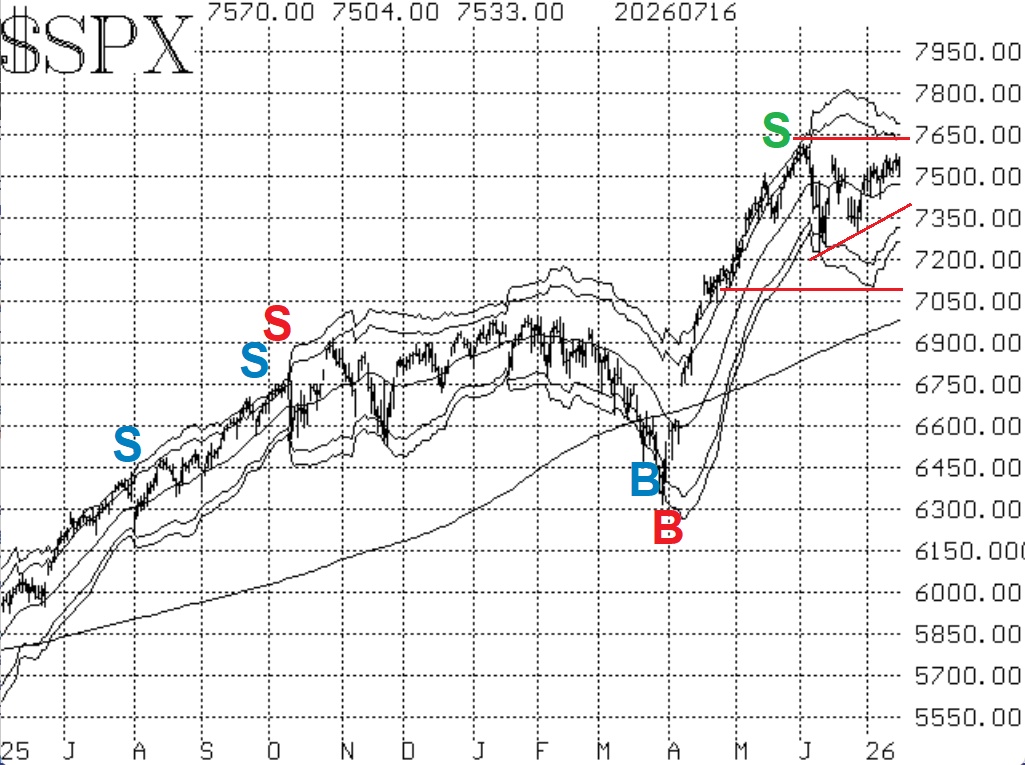
By Lawrence G. McMillanBuying the dip has been working on an intraday basis recently, but the larger picture is that there are dips to buy almost every day. That means that $SPX is not making much...
Jul, 13, 2026
By Lawrence G. McMillanJoin Larry McMillan as he discusses the current state of the stock market on July 13, 2026.
Jul, 10, 2026
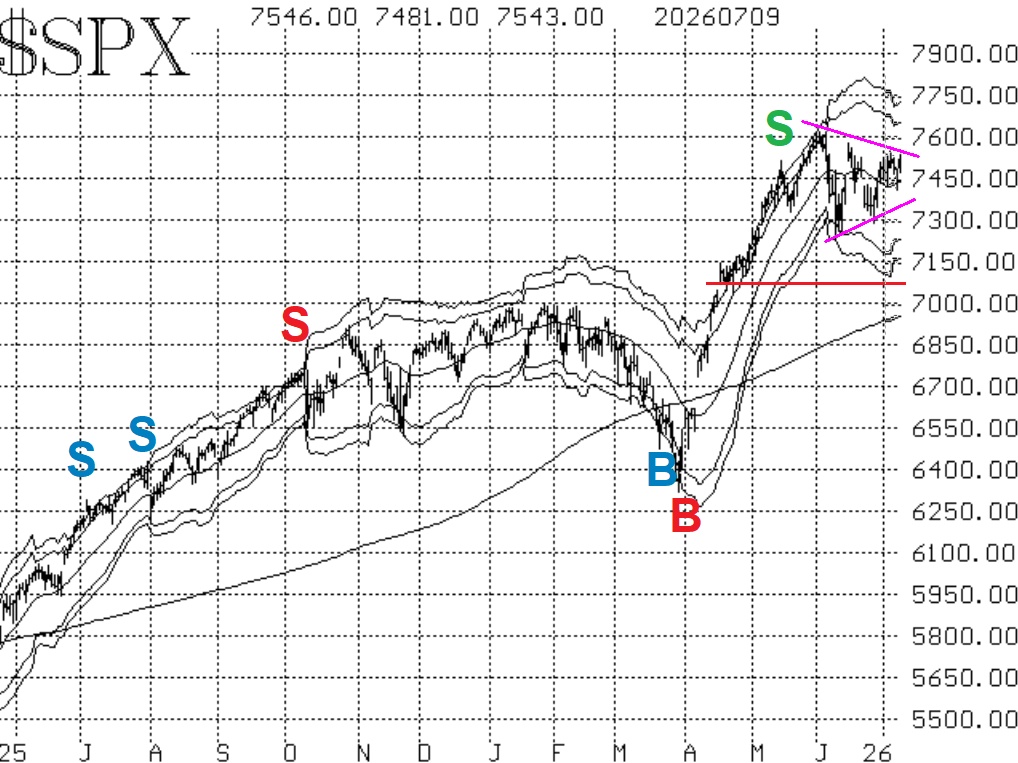
By Lawrence G. McMillanThis week, $SPX has tried to break out over the top of the triangle formation that has inhibited price movement since early June. Indicators have improved somewhat, so that is...
Jul, 07, 2026
By Lawrence G. McMillanVolatility products like VXX remain among the most misunderstood trading vehicles, and many of the misconceptions that existed when this article was first published still...

Jul, 06, 2026
By Lawrence G. McMillanOne of the standing guidelines that appears in every issue of The Daily Volume Alerts is:“In positions with just outright long options (including long straddles), roll if that...

Jul, 06, 2026
By Lawrence G. McMillanFor a limited time, get Lawrence G. McMillan's 14-Seminar Home Study Course for only $99 (regularly $499).Whether you're just getting started with options or looking to sharpen...
Jul, 06, 2026
By Lawrence G. McMillanJoin Larry McMillan as he discusses the current state of the stock market on July 6, 2026.
Jul, 02, 2026
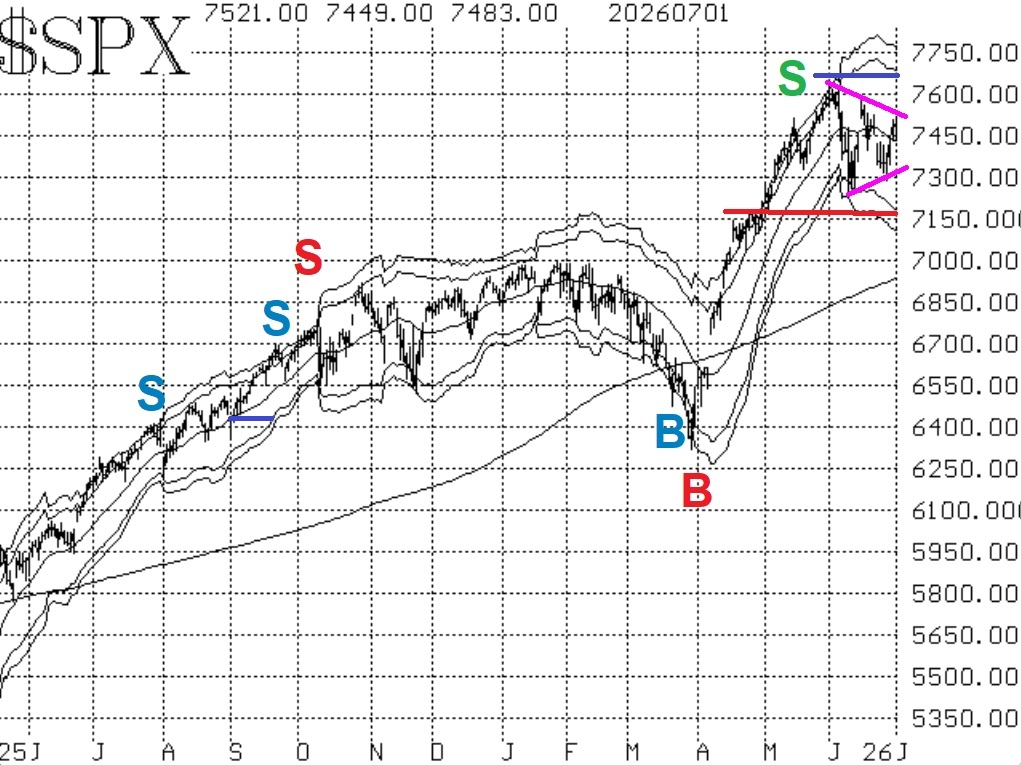
By Lawrence G. McMillanThe market continues to consolidate in the triangle formation that we had pointed out previously. It is currently trying to break out on the upside. The pink lines on the chart...
Pages
© 2023 The Option Strategist | McMillan Analysis Corporation