
Jun, 01, 2026
By Lawrence G. McMillanJoin Larry McMillan as he discusses the current state of the stock market on June 1, 2026.
May, 29, 2026
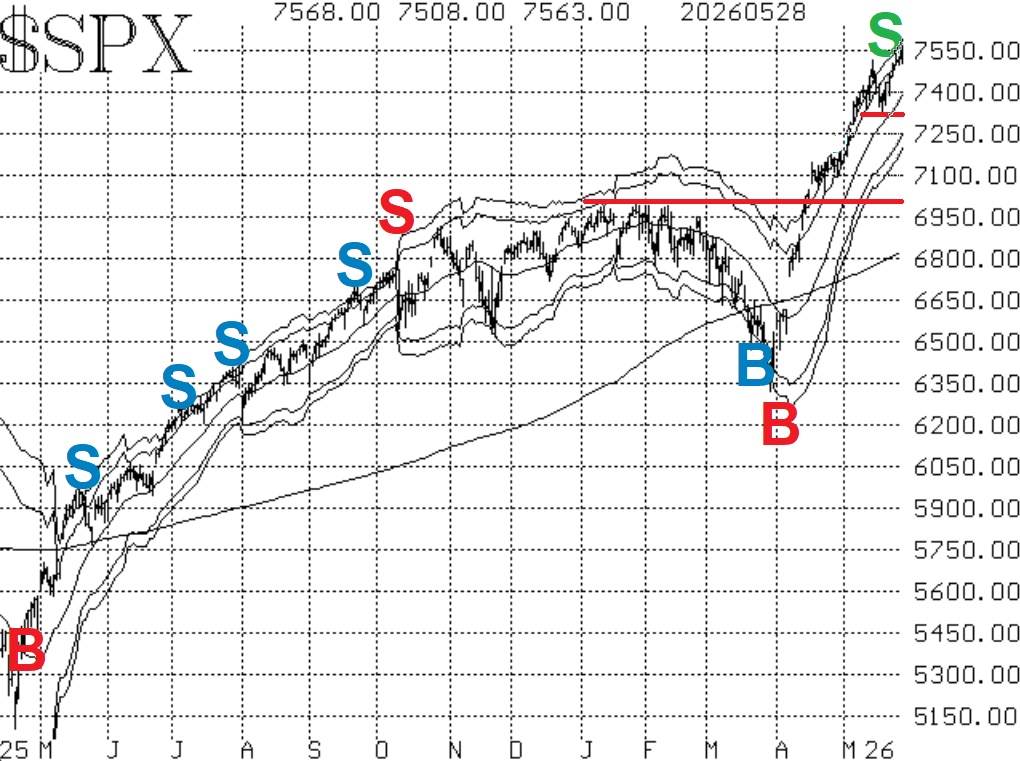
By Lawrence G. McMillanThis market is the epitome of our phrase, "overbought does not mean sell." It just keeps going higher, and now the rally has broadened enough so that the Dow ($DJX; DIA),...

May, 29, 2026
By Lawrence G. McMillanIn 1973, inflation, interest rates, and impeachment dominated headlines during a brutal bear market. Today, a different set of "I's" is making news, yet stocks continue to push...
May, 28, 2026
By Lawrence G. McMillan0DTE (Zero Days to Expiration) options have rapidly become one of the fastest-growing areas of the options market. Trading volume in products such as $SPX, SPY, and QQQ has...
May, 26, 2026
By Lawrence G. McMillanJoin Larry McMillan as he discusses the current state of the stock market on May 26, 2026.
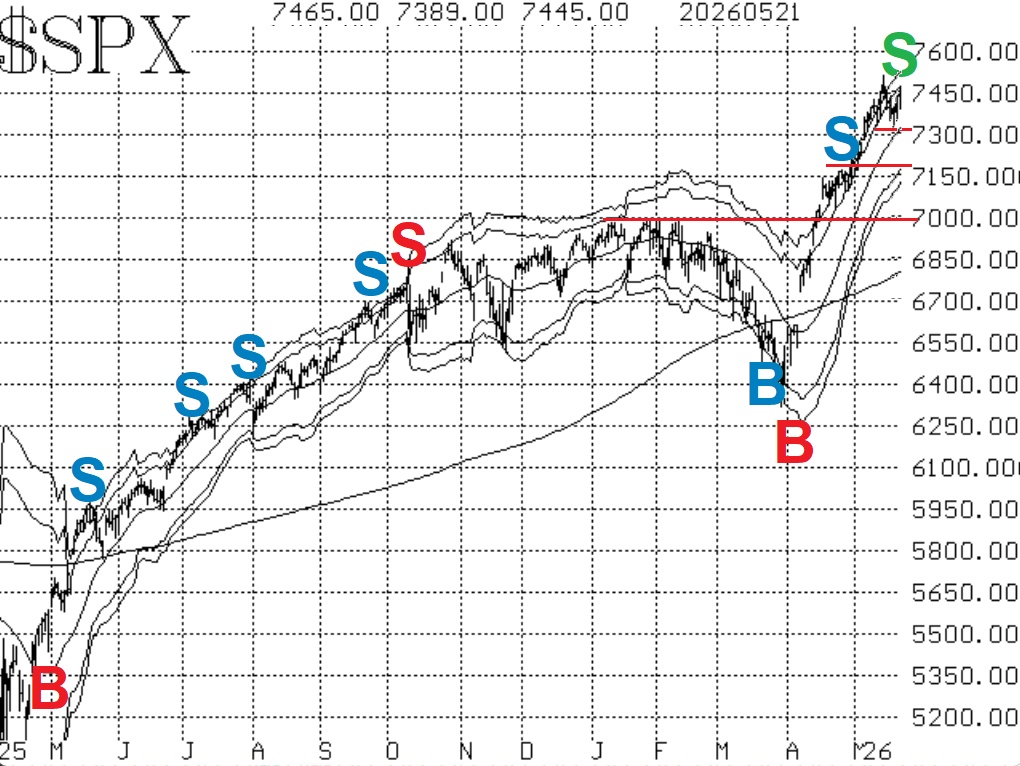
May, 22, 2026
By Lawrence G. McMillanThree different internal indicators have generated sell signals over the past week or so, but the most important indicator -- the chart of $SPX remains bullish. When these...

May, 20, 2026
By Lawrence G. McMillanThis Memorial Day weekend, McMillan Analysis is offering 25% off all advisory services.Whether you’re looking for daily market commentary, volatility analysis, put-writing...
May, 19, 2026
By Lawrence G. McMillanJoin Larry McMillan as he discusses the current state of the stock market on May 18, 2026.
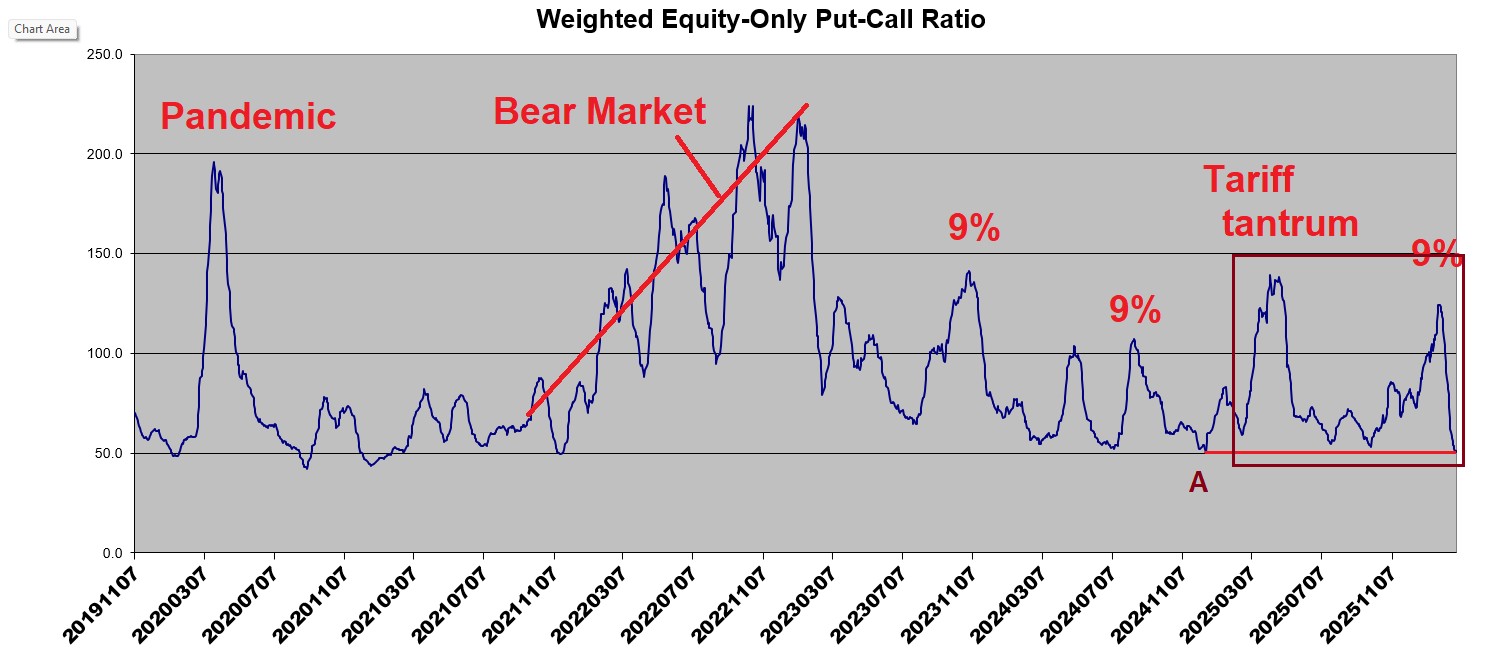
May, 18, 2026
By Lawrence G. McMillanWith euphoria abounding in the stock market, call buying has been rampant. That has forced the put-call ratios to drop precipitously. The weighted ratio is at a multi-year low...
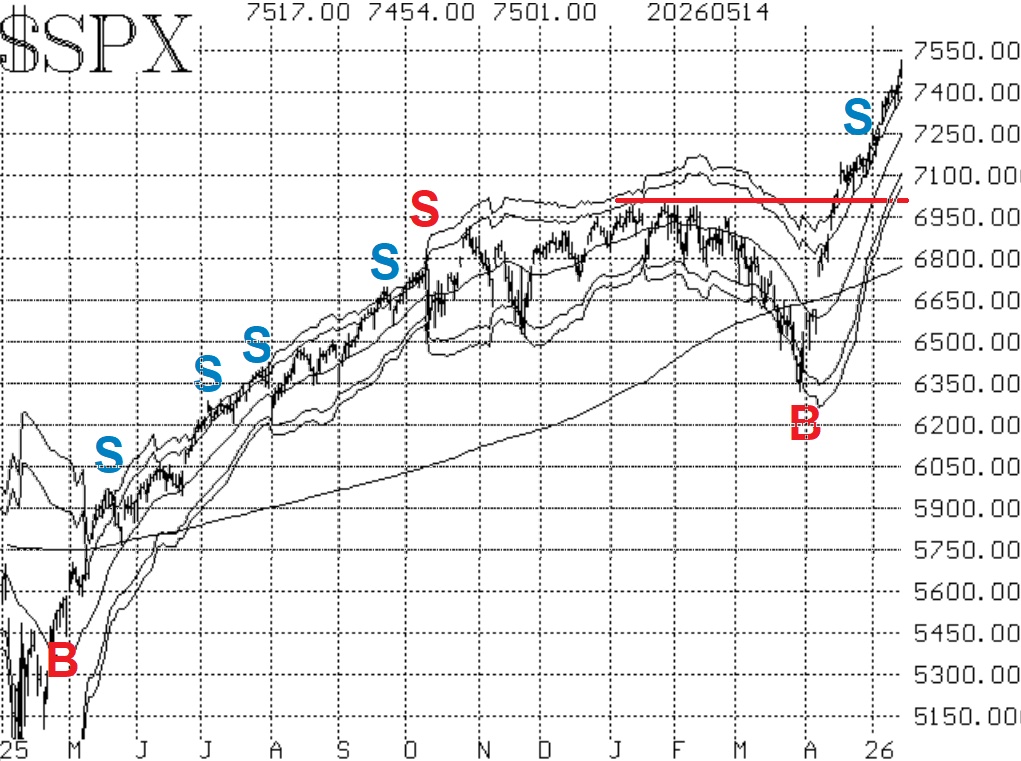
May, 15, 2026
By Lawrence G. McMillan$SPX continues to surge, having made new all-time highs on four or the last five trading days. There is minor support at 7338 (the past week's low), and at 7275 (the bottom of...
Pages
© 2023 The Option Strategist | McMillan Analysis Corporation