
By Lawrence G. McMillan
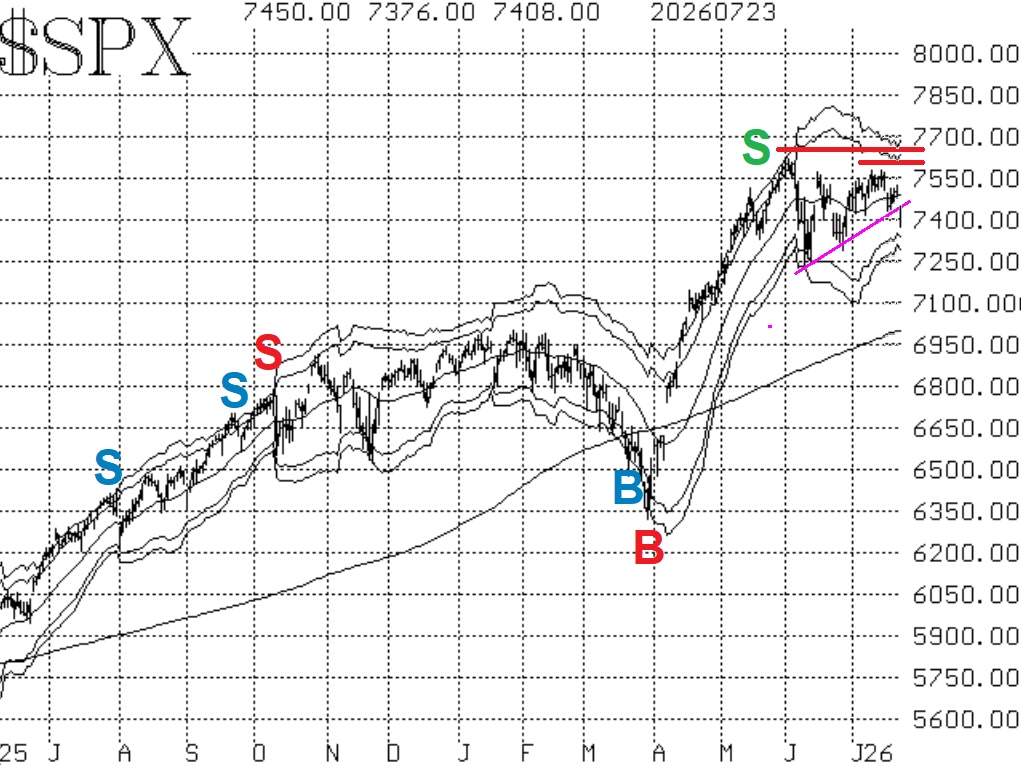
The market has been frustrating to many over the past two months since new all-time highs were made in early June. Bulls expected another attempt at new highs by now, while bears expected a larger correction (given the uncertainties of Iran, interest rates, etc.). But the fact is, $SPX has remained in a trading range over that time.
There is currently resistance at 7580 (July's highs) and then at the all-time highs in the 7600-7620 area. Support was broken slightly yesterday, as $SPX probed downward, but there is support at 7300 or slightly above that level, with further support at the July lows near 7250.
Internal indicators are generally negative or weakening. For example, the equity-only put-call ratios are on the rise once again, and that is bearish for stocks as long as it persists.
Breadth has been even worse over the last week. This has kept the breadth oscillators on sell signals.
Implied volatility $VIX and its various components has tried to edge higher this week. It has probed above the 200-day Moving Average on several occasions, but has not closed above there. So the trend of $VIX buy signal (for stocks) remains in place for now. A two-day close by $VIX above the 200-day MA will stop that out. The 200-day MA is just below 19.
In summary, $SPX remains trapped in a trading range. There have been some negative developments in the internal indicators, but unless $SPX itself actually breaks down, those won't mean much. We will continue to take new confirmed signals as they occur and to roll deeply in-the-money positions.
This Market Commentary is an abbreviated version of the commentary featured in The Option Strategist Newsletter.

© 2023 The Option Strategist | McMillan Analysis Corporation