
By Lawrence G. McMillan
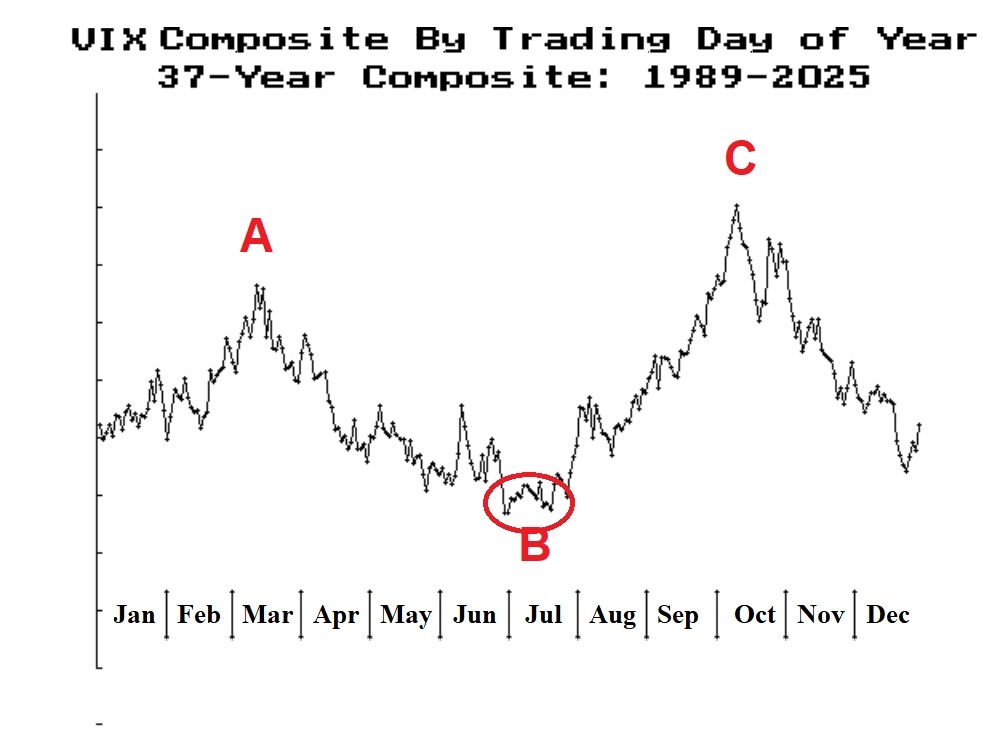
It is once again time to consider that $VIX may have bottomed for the year. It is a common occurrence for $VIX to make its annual lows in July and then begin to rise in August. Sometimes that rise is stupendous, as it was two years ago. Most of the time the annual peak for $VIX is reached in October, which is when the market often sells into a strong bottom. We can compose a seasonal chart of $VIX. Chart 1 encompasses the years 1989 through 2025 (the most recent full year of trading). While there is $VIX data for earlier years, including 1987 and even 1988 distorts things too much. The data in Chart 1 uses the “current $VIX at the time” – regardless of how it was calculated.[1]
Let’s take a look at the chart above. Early in the year there is often a volatility increase. It was most prominent in March 2020 and April 2025, and it is noted in the chart by $VIX rising into point A in mid-March, using all the years in question.
Then volatility begins to lag, as the market generally rallies, or is at least complacent, into July. That brings the composite $VIX chart down to point B – its low for the year. We are there right now. It is often the case that everything seems calm and worry-free, with $VIX at its lows.
But that is not really the case...
Read the full article by subscribing to The Option Strategist Newsletter now. Existing subscribers can access the article here.

© 2023 The Option Strategist | McMillan Analysis Corporation