By Lawrence G. McMillan
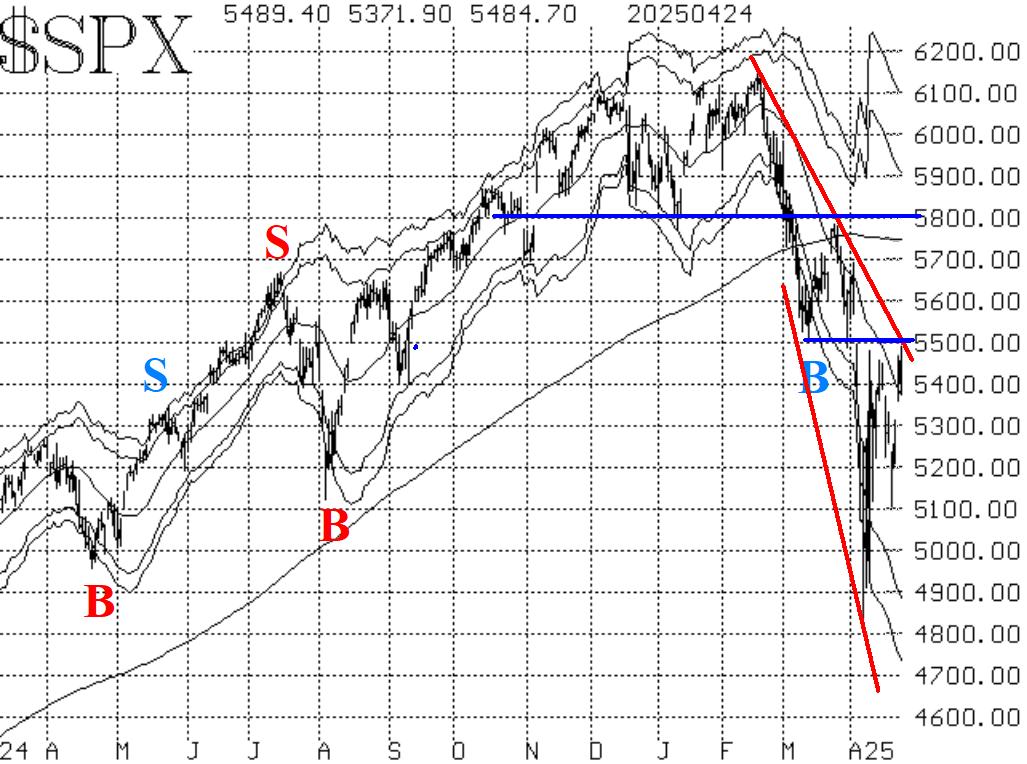
It really feels like the market is rallying strongly, and perhaps the bottom is in. But the evidence is not clear on that. Even though $SPX has rallied nearly 400 points from Monday's lows, this is still a bearish $SPX chart. First of all, the pattern of lower highs and lower lows is intact. Second, $SPX has not overcome resistance in the 5500 area. Even if it were to rally above 5500 somewhat (perhaps getting nearer to the now-declining 200-day Moving Average) and then turn back down, that would still leave a pattern of lower highs on the chart albeit with a less steep slope on the downtrend line. In my opinion, only a close above 5800 would remove the negativity from this chart.
There is support at 5100 (Monday's lows) and then below that at 4850-4950 (the lows of early April). The volatility of this market continues to amaze me. I think we have gotten used to volatility on down days, but the swiftness of the rise this week is equally amazing and not necessarily bullish. When volatility is high and/or increasing, that is not a good sign for stocks. The realized volatility of the market, as measured by the 20-day historical volatility of $SPX (HV20) is 50%, the highest since the pandemic of March-April 2020. That is why the "modified Bollinger Bands" (mBB) on the chart in Figure 1 are so far apart.
Equity-only put-call ratios are hovering near their recent peaks. In fact, they are so near those peaks that the computer analysis programs have rated them both as "sell." That is, the projection is that these ratios are about to move to new highs. That would prevent buy signals, and frankly would be another bearish sign for this market.
Breadth has improved a lot, and both breadth oscillators have generated buy signals with 2-day confirmation. Not only that, but the "oscillator differential" generated a short-term buy signal that was closed out this past week.
Implied volatility has been declining this week, along with the $SPX rally. The decline has been relatively modest. The "spike peak" buy signal of April 7th remains in place. It lasts for 22 trading days. It would be stopped out by a $VIX close above that recent peak of 60.10. Frankly, that stop is so far away that it doesn't make sense to keep it there. It would be more logical to use a stop of 34, say the $VIX highs of this week.
In summary, we are maintaining a "core" bearish position because of the negative $SPX chart. However, we will trade all confirmed signals as they occur. Meanwhile, continue to roll deeply in-the-money options.
This Market Commentary is an abbreviated version of the commentary featured in The Option Strategist Newsletter.

© 2023 The Option Strategist | McMillan Analysis Corporation