Oct, 13, 2025
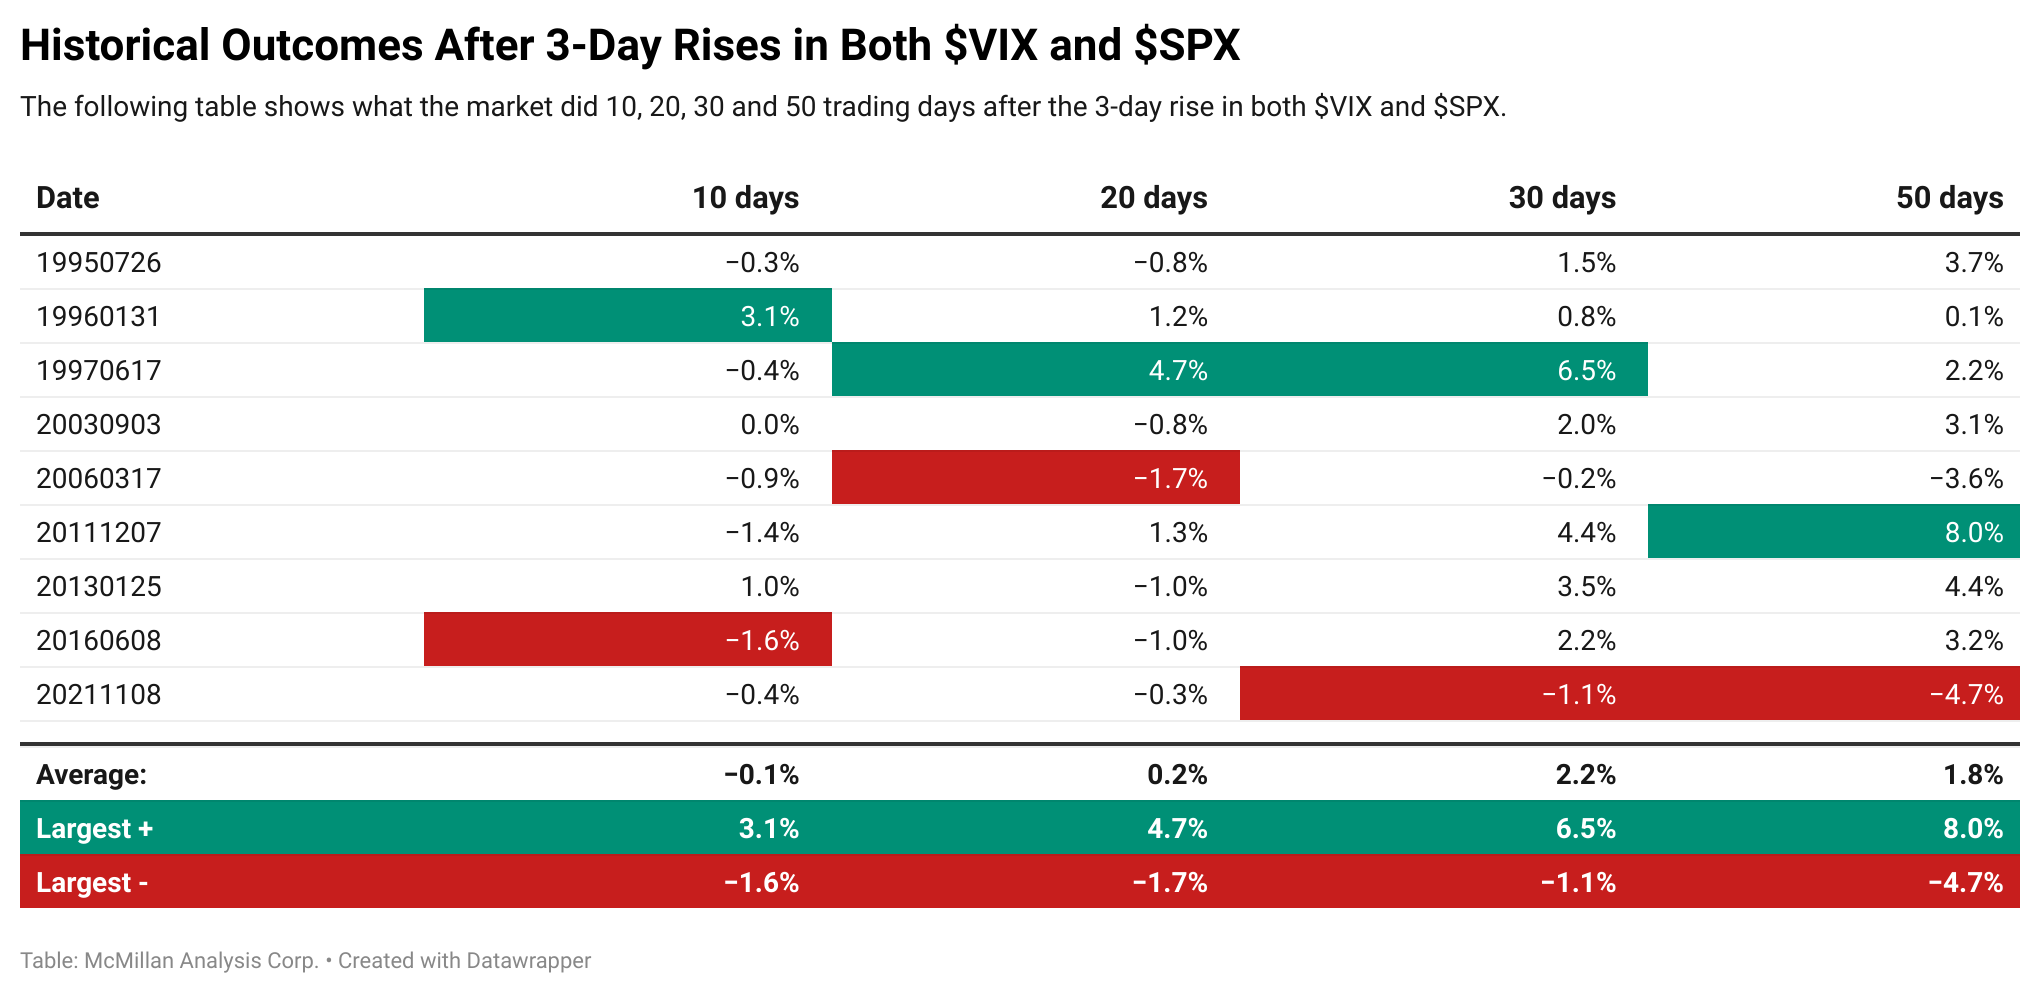
By Lawrence G. McMillanWe’re going to look at two things here. First, there was recently a period of five trading days in which both $VIX and $SPX were up each day. That has never...

Oct, 13, 2025
By Lawrence G. McMillanJoin Larry McMillan as he discusses the current state of the stock market on October 13, 2025.
Oct, 10, 2025
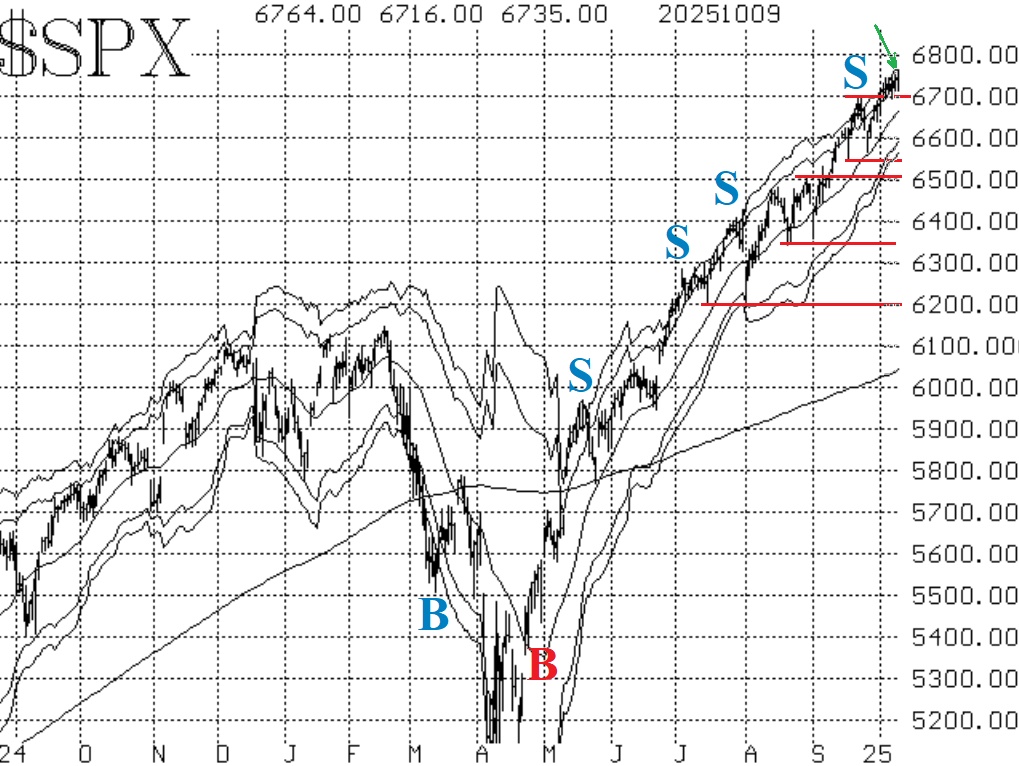
By Lawrence G. McMillanStocks continue to move higher, with $SPX making new all- time highs nearly every day. This has produced some overbought conditions, which we will discuss, but the $SPX chart...

Oct, 08, 2025
By Lawrence G. McMillanLast week, something unusual happened — both the S&P 500 ($SPX) and the CBOE Volatility Index ($VIX) rose every single trading day. It’s a rare alignment, and one that...
Oct, 06, 2025
By Lawrence G. McMillanJoin Larry McMillan as he discusses the current state of the stock market on October 6, 2025.
Oct, 03, 2025
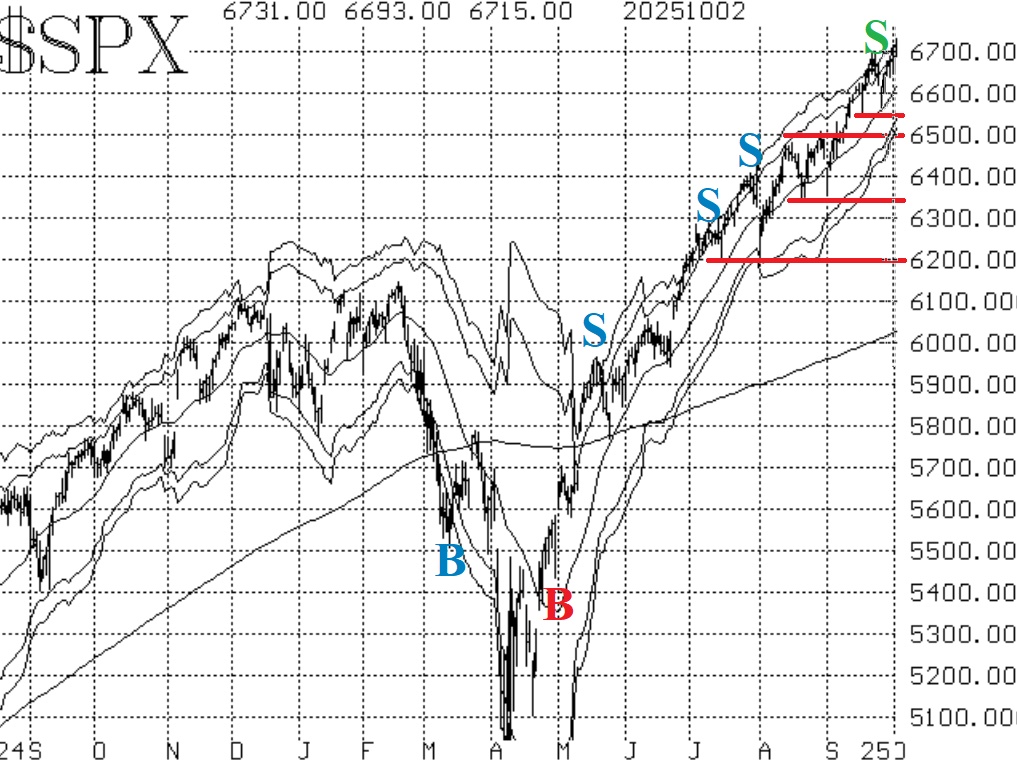
By Lawrence G. McMillanThe stock market didn't seem to care much about the government shutdown at all. This is a government spending shutdown and is not nearly as negative for stocks as would be a...
Sep, 29, 2025
By Lawrence G. McMillanJoin Larry McMillan as he discusses the current state of the stock market on September 29, 2025.
Sep, 26, 2025
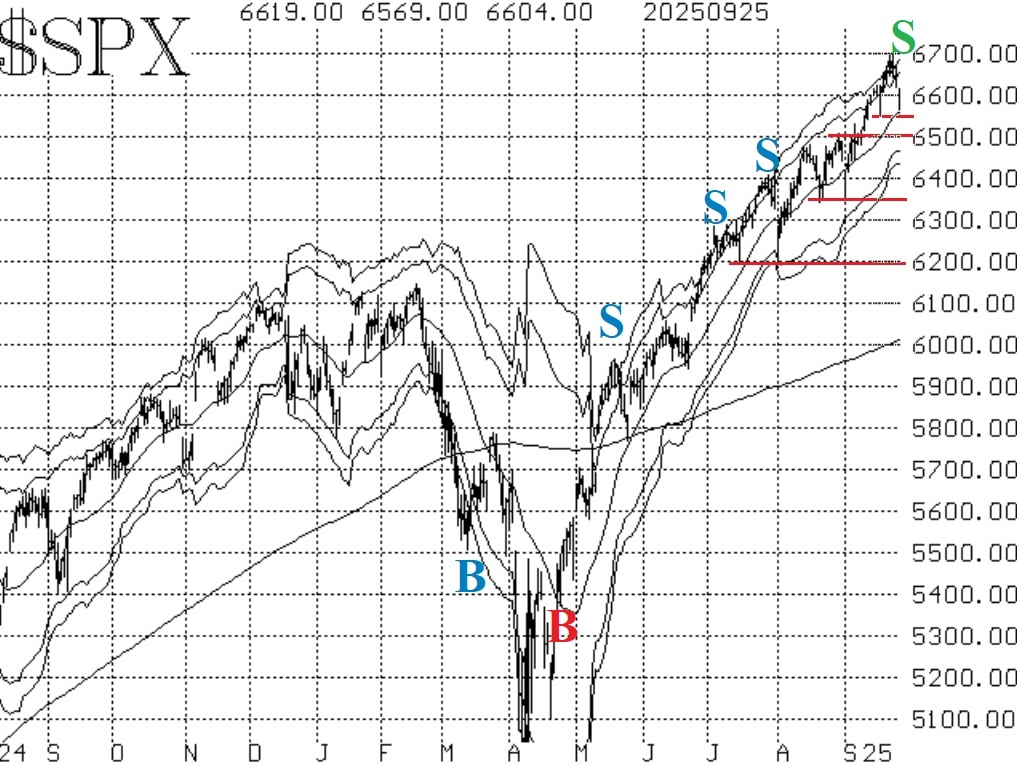
By Lawrence G. McMillanStocks made new all-time highs again this past week, but early in the week. Even then, breadth wasn't good. Now $SPX has pulled back slightly from those intraday all-time highs...
Sep, 23, 2025
By Lawrence G. McMillanJoin Larry McMillan as he discusses the current state of the stock market on September 23, 2025.
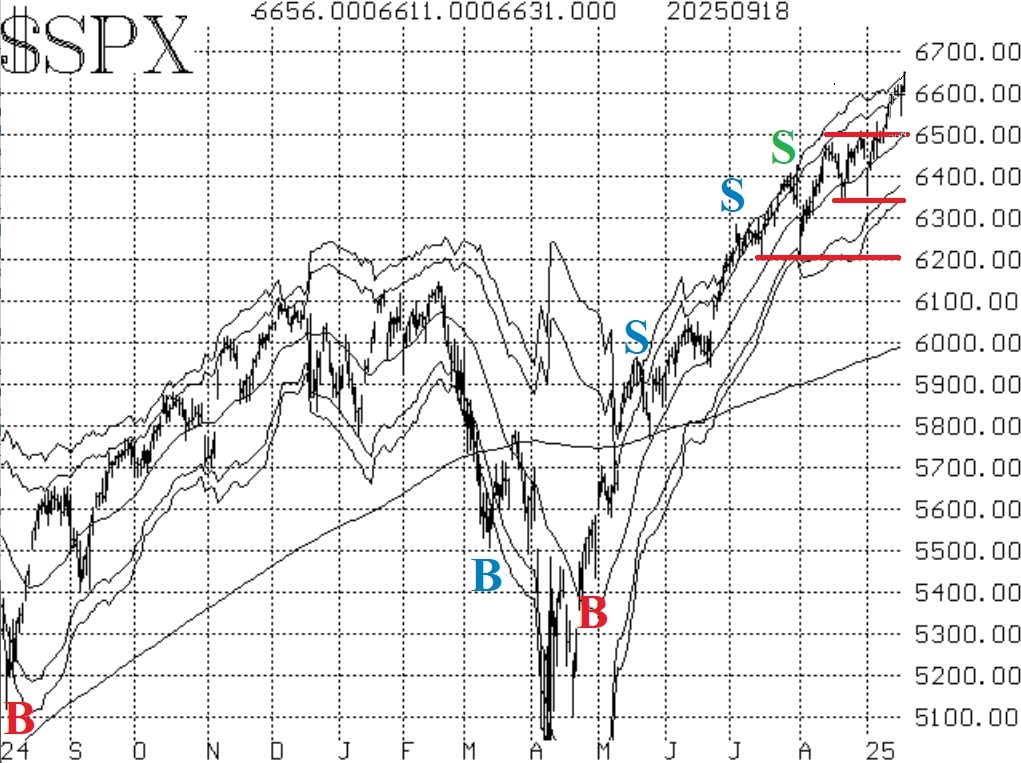
Sep, 19, 2025
By Lawrence G. McMillanThe Fed lowered rates by a quarter of a percent on Wednesday, and the market liked it. Many people had been expecting a "sell on the news" after that, but instead $SPX has...
Pages
© 2023 The Option Strategist | McMillan Analysis Corporation