By Lawrence G. McMillan
The stock market, as measured by the Standard and Poors 500 Index ($SPX) continues to break down through important support levels. It is the close below 1395 that matters. This should activate targets as low as 1330, although it probably won't be in a straight line, for $SPX worked back and forth between 1330 and 1370 in July, and that range should provide some support.
By Lawrence G. McMillan
Stocks are trying to make sense of the election results, the newly bad news out of Europe, and the potentially foreboding “fiscal cliff.” This resulted in some very volatile action in the market Wednesday — especially if one also includes the overnight session in the S&P futures last night.
By Lawrence G. McMillan
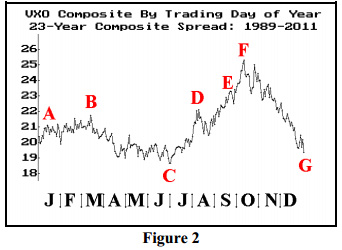
We occasionally publish charts showing the seasonal pattern of $VIX. Figure 2 below shows the composite price of $VIX for a 23-year history (1989 through 2011). This chart is constructed simply by following this method: gather the 23 $VIX prices for the first trading day of the year, sum them, divide by 23, and that is the first point to plot on the left of the graph. Continue that way throughout the year.
By Lawrence G. McMillan
MORRISTOWN, N.J. (MarketWatch) — Ever since the stock market, as measured by the Standard & Poor’s 500 Index SPX broke down through support late last month (on Oct. 23), the bulls have been struggling to regain control.
By Lawrence G. McMillan
Ever since the stock market, as measured by the Standard & Poors 500 Index ($SPX) broke down through support late last month (on October 23rd), the bulls have been struggling to regain control. They have not done so -- yet. However, yesterday's rally has brought $SPX right back up to the 1430 level, and we are still in the October bullish seasonal period for one more day.
By Lawrence G. McMillan
For a considerable period of time, $SPX refused to break down. From the June lows to the October highs, the trend was steadily upward as $SPX traded in a bullish channel. However, that channel was broken on Tuesday of this week, when $SPX broke through it and also broke through support at 1425-1430. This has changed the $SPX chart from bullish to, at best, neutral. Those who want final confirmation would also require a breakdown below the August lows at 1395. That would confirm an intermediate-term bearish outlook for stocks.
By Lawrence G. McMillan
A week ago, stocks seemed to be on the brink of breaking down. But the bulls regrouped, and $SPX rallied strongly off of that support base. Hence, the 1425-1430 area is now stronger support than ever.
Equity-only put-call ratios are the most bearish indicator of the lot. They continue to rise rapidly, after having given sell signals last week. Since they are still rising, they are still on those sell signals.
Market breadth indicators are hovering right on the edge of sell signals.
By Lawrence G. McMillan
MORRISTOWN, N.J. (MarketWatch) — The stock market has generally been declining since September 14th — the day after the Fed announced the latest round of Quantitative Easing.
Not only was the market overbought at that time, but the Fed’s announcement was widely anticipated news.
By Lawrence G. McMillan
$SPX rallied strong yesterday, bouncing off the support at 1425-1430, and that support was/is bolstered by the rising trendline at the bottom of the trading channel that has defined this bull market since June. The buying accelerated late in the day, and it seemed as if the bears were capitulating to some extent. Overnight, S&P futures have been strong again – gaining another 7 points in Globex trading.
By Lawrence G. McMillan
We have been bullish continuously since early June. But recent events and indicator changes have put this short-term forecast into jeopardy.
$SPX has support at 1430 from two downward probes in September. This week, that has also been the low. Hence, it has become important support.
One of the more negative developments is the fact that both the standard and the weighted equity-only put-call ratios are on sell signals now.