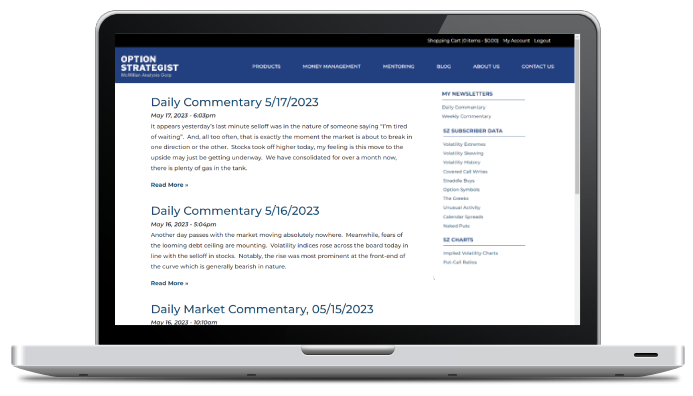
The Strategy Zone
Put-Call Ratio Charts, Volatility data, Option Analysis and Much More
The Strategy Zone is the subscription section of our website designed for "do it yourself" option traders. Updated on a daily basis, The Strategy Zone contains valuable data on stock, index, and futures options including trading candidates for covered writes, naked put sales, straddle buys, and calendar spreads. A wide array of volatility data is included along with a daily mid-day market commentary, over 200 put-call ratio charts, volatility charts, and back issues of McMillan newsletters. Sign up today for less than $25 a month, and start analyzing the market yourself.
A Strategy Zone subscription includes:
- Market Commentary and Analysis
A mid-day market analysis and a Friday weekly commentary drawing from a range of proprietary technical indicators and macro economic themes. - Daily Volatility Data
Includes lists identifying volatility extremes, volatility history, and volatility skews. - Scans of Potential Trading Candidates
Daily lists of potential covered writes, naked put sales, straddle buys and calendar spreads using McMillan's proprietary analyses. - The Greeks
Delta, Gamma, Theta, and Vega readings for every stock, index, and futures option traded the previous day. - Unusual Option Activity Scan
A summary of unusual option activity for the previous trading day similar to the analysis found in McMillan's Daily Volume Alerts newsletter. - Back Issues
Archives of past McMillan newsletters (Daily Commentary, Weekly Updater). - Put-Call Ratio Charts
Nearly 200 put-call ratio charts posted daily, including both "weighted" and "standard" graphs, along with an unscaled chart of the underlying on the same graph. Put-call ratio charts are a valuable tool for sentiment-based, contrarian analysis. - Implied Volatility Charts
A daily posting of 300 or more implied volatility charts showing the implied volatility history for the past year, again with an unscaled chart of the underlying.
Testimonials
"I can't see myself ever trading again without the Zone. It's a light in a dark room that just switched on, yet now I feel like a blind man who has more enhanced use of the other senses newly acquired because the noise from too much information is gone. I've even had good luck with the OEX just on Mr McMillan's daily market commentary."
- A. Leone
"Let me tell you that this is by far the most professional site that offers the most interesting and effective tools to the active trader."
- O. Atal
"This is truly outstanding information for the price."
- Mark G.
"Since I'm more interested in data and screens than in specific recommendations (for now at least), The Strategy Zone is a really amazing resource -- your services just keep getting better!"
- D. Fylstra
Satisfaction Guaranteed
 If you are not completely satisfied with your subscription, you may cancel at any time and a prorated refund will be issued based on the remaining unused portion of the subscription.
Free Trial Subscriptions are not renewed automatically. Paid Trial Subscriptions will renew at the shortest subscription length offered (e.g. monthly / quarterly). Paid auto-renew subscriptions are set to automatically renew monthly, quarterly, or annually for your convenience and to avoid any interruption of service.
© 2026 The Option Strategist | McMillan Analysis Corporation


