McMillan Volatility Bands Buy/Sell Signals
Charting signals and a daily signal scanner based on McMillan's Modified Bollinger Bands for TradingView.
McMillan Volatility Bands, a charting analysis tool developed by world-renowned options trader and author Lawrence G. McMillan, is an optimized approach to John Bollinger's Bollinger Bands. Leveraging his expertise in options trading, Lawrence designed this volatility-based strategy with a focus on how option prices are calculated – using the Black-Scholes definition of volatility. The McMillan Volatility Bands pricing model assumes a financial asset's volatility should be measured in percentage change rather than absolute value change.
Overview
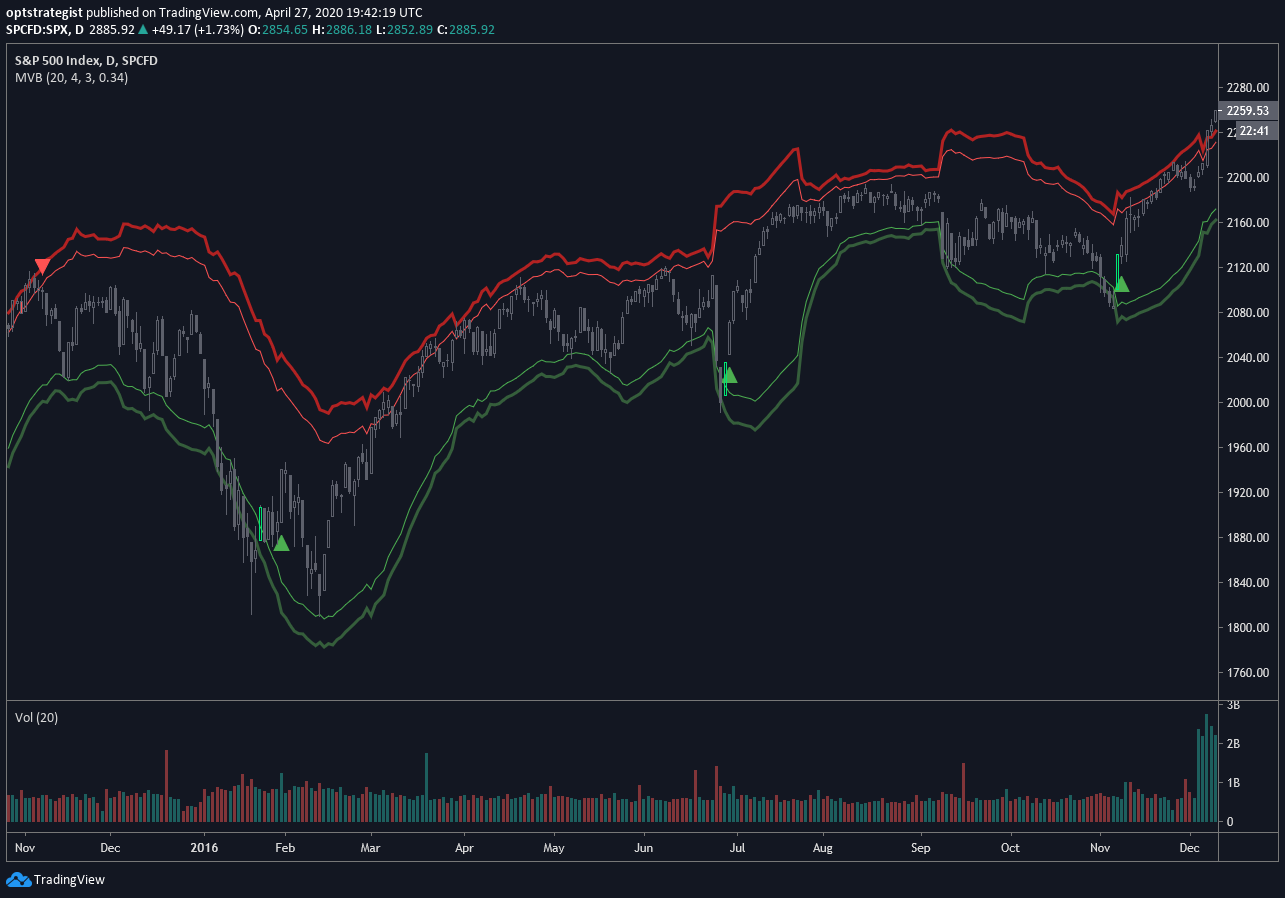
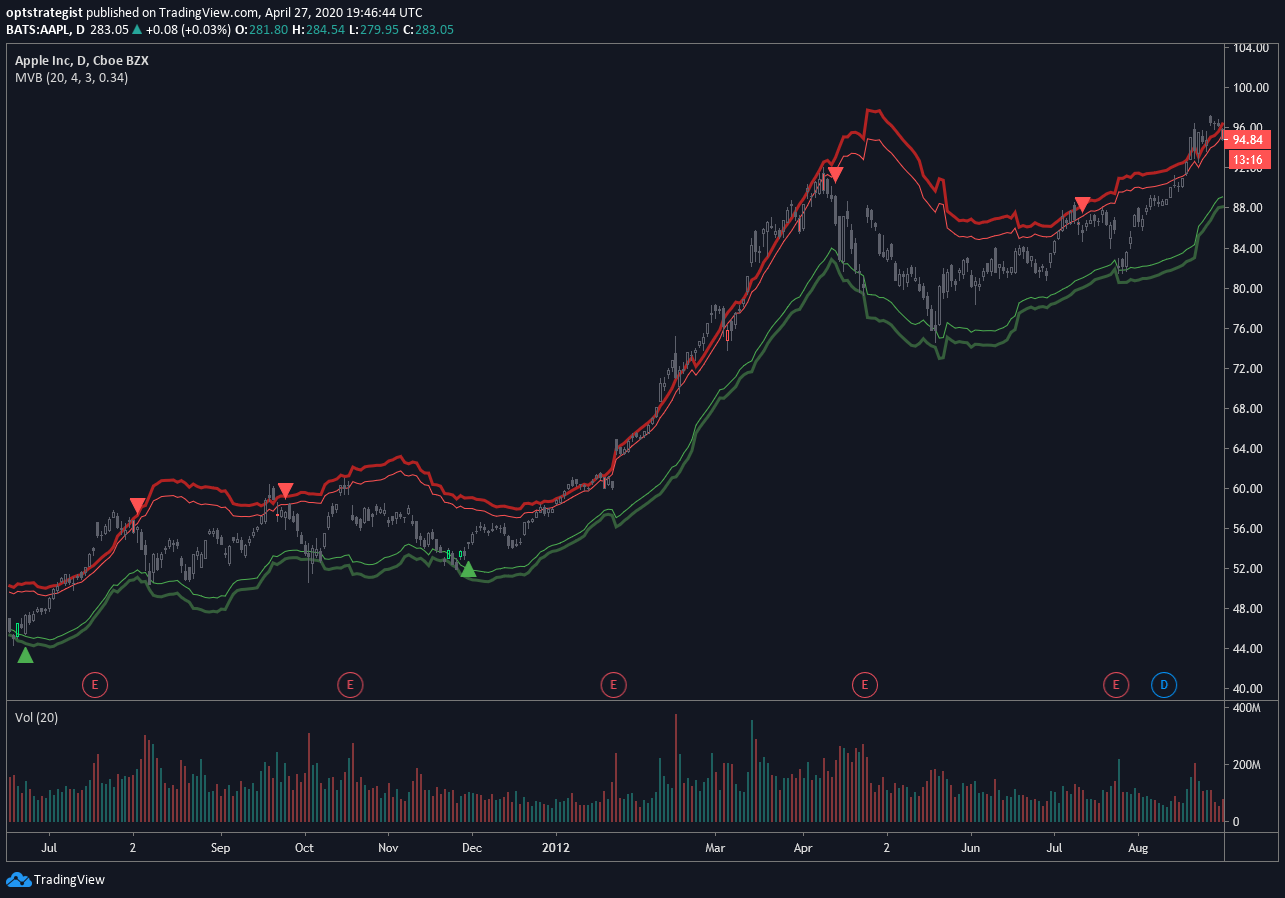
The McMillan Volatility Bands charting indicator for TradingView will plot the 3 and 4-standard deviation bands around a 20-day moving average, giving you the same parameters Lawrence has used in his own analysis for many years. The user can, however, change the standard deviation value, as well as the moving average length, to their preferred setting. The McMillan Volatility Bands indicator can theoretically be used on any asset and on any time frame.
In addition to the standard deviation bands and moving average trendline, the indicator will also plot Buy and Sell signals based on a well-established trading system used by McMillan in his newsletter publication, The Daily Strategist. The system gives a buy or sell signal when price closes outside the 4-sigma band, then closes back within the 3-sigma band. The 'signal bar' will be colored green or red for a buy or sell signal setup, respectively.
Finally, an arrow indicator will be plotted on the chart where the trading system would actually enter the trade. The arrow indicator is determined when price trades at a designated measurement beyond the extreme of the 'signal bar'. This measurement is an input parameter and can be adjusted by the user. We've chosen the default value of 0.34, meaning the indicator will not give a buy or sell entry until the price moves 1/3 x beyond the extreme signal bar. We’ve found this measurement successfully removes less-valuable trade setups and prevents getting whipsawed by some setups that never really move in your favor.

Charting Access
Please supply your TradingView username in the comment section during checkout. Upon purchase you will be added to view the charting signals through TradingView. Please wait up to 24 hours for access.
Parameters
- ma_length => length of the moving average that the volatility bands work off of
- outside_sigma => standard deviation of outer volatility band
- inside_sigma => standard deviation of inner volatility band
- entry_trigger_cushion => this refers to the percentage of the signal bar's range. The default value is 0.34. This means price will need to move 1/3 (~34%) of the signal bar's range beyond the high (for a buy) or low (for a sell) of the signal bar to trigger a buy/sell entry. This entry plots the arrow on the chart. We have found requiring this extra move in price eliminates many of the less-desirable signals at the expense of entering the better signals a little later.
Chart Examples
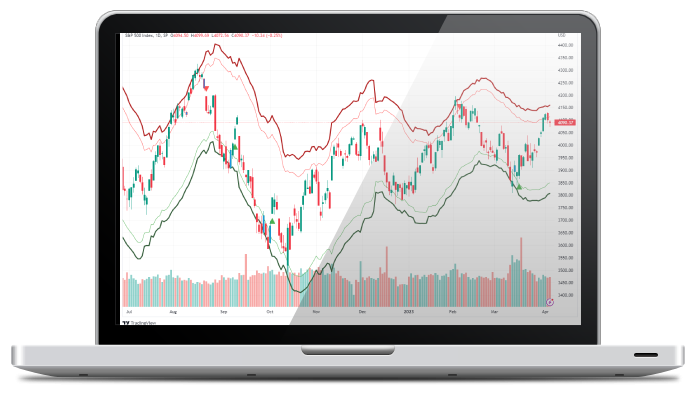
Below are some examples of the charts and signals.

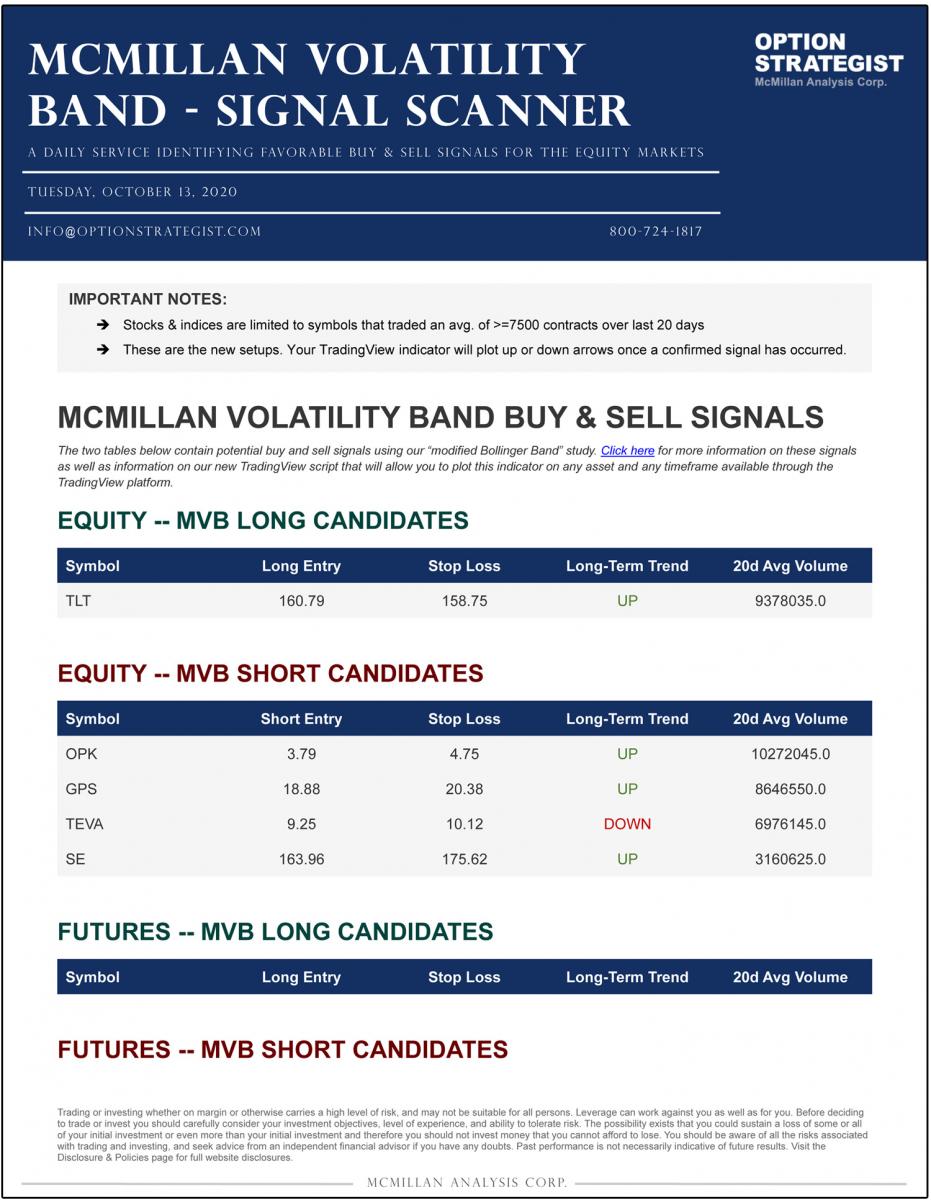
McMillan Volatility Bands Signal Scanner
The McMillan Volatility Band Signal Scanner add-on compliments our McMillan Volatility Bands (MVB) TradingView indicator. All new MVB subscriptions now include the MVB Signal Scanner. Each morning, you will receive an email containing the new MVB buy & sell signals from our curated list of tradable assets. This list includes all liquid futures contracts, cryptocurrencies, and stocks/etfs that trade above-average volume of options. We've found that this group of stocks presents the best candidates for directional trading systems. Note: the scanner cannot be purchased on its own.
Below is an example of a daily file for the Signal Scanner:
Satisfaction Guaranteed
 If you are not completely satisfied with your subscription, you may cancel at any time and a prorated refund will be issued based on the remaining unused portion of the subscription.
Free Trial Subscriptions are not renewed automatically. Paid Trial Subscriptions will renew at the shortest subscription length offered (e.g. monthly / quarterly). Paid auto-renew subscriptions are set to automatically renew monthly, quarterly, or annually for your convenience and to avoid any interruption of service.


© 2026 The Option Strategist | McMillan Analysis Corporation