Serious Tools for Serious Option Traders
Option Workbench enables you to seek success in the options markets by giving you the potential to analyze volatility, risk and trading strategies like never before. Unlike programs that focus primarily on execution or position management, Option Workbench gives you the tools to perform sophisticated pre-trade analyses. It uses data from The Strategy Zone database to help you analyze the Greeks of a position, find trading opportunities, compare strategies and increase your profit and win ratios.
How Option Workbench Can Help You Find Potentially Winning Opportunities
![]() Option Workbench has a unique advantage: its access to the Strategy Zone database. This access enables Option Workbench to use the Strategy Zone’s invaluable data on stock, index, and futures options including trading candidates for covered writes, naked put sales, straddle buys and calendar spreads. Option Workbench provides you with data and tools for analyzing:
Option Workbench has a unique advantage: its access to the Strategy Zone database. This access enables Option Workbench to use the Strategy Zone’s invaluable data on stock, index, and futures options including trading candidates for covered writes, naked put sales, straddle buys and calendar spreads. Option Workbench provides you with data and tools for analyzing:
- Daily historical volatility
- Implied volatility extremes and skews
- Unusual volume reports
- Expected returns
- And other drivers of option dynamics
It integrates key pricing and volatility data into a single table that presents a profile of the option market for each stock, index and future covered. Extensive sorting and filtering capabilities allow you to dissect the data in numerous ways so you can zero in on trading opportunities. Once you identify a promising option profile, you can further investigate the option’s details with Option Workbench’s tools.
Introducing Option Workbench 4.0!
The latest release of Option Workbench has a new look and feel and contains a ton of new features and options including earnings data, position editor enhancements, position creation, position management and a portfolio monitor. Click here for a more detailed explanation or watch the video below
Click here to watch more Option Workbench tutorials »
Option Workbench Tools
The following is an overview of the various Option WorkBench tools.
The Dashboard
The Dashboard has three sections: the latest market commentary from the Strategy Zone, the IV (Implied Volatility) Histogram and the VIX (Volatility Index) Term Structure chart.
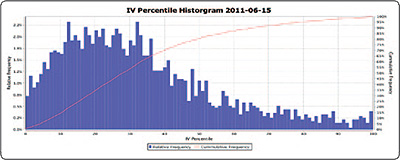
The IV Histogram provides a broad-spectrum rich/cheap analysis of the equity, ETF and index options markets. The IV Histogram is an important first step in deciding how to apply the powerful Option Workbench filters to option profiles.
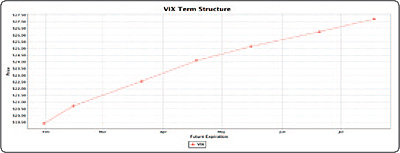
The VIX Term Structure chart shows the values of spot VIX and VIX futures prices. The VIX Term Structure is an important indicator of the option market’s short-term view of equity prices.
The Option Pricing Sheet
The option pricing sheet is a unique display of option data similar to reports used by floor traders. It shows a matrix of rows containing option prices, implied volatility and Greeks grouped by strike price, and columns with calls and puts grouped by expiration dates. This layout allows you to view more data at a glance than the collapsible single-month layouts used by most broker pricing screens, accelerating your analyses and decisions.
You can use the most recent market data by editing the underlying price as well as each option price and implied volatility cell. Doing so automatically recalculates the option Greeks.
The Implied Volatility Chart
This chart presents a graphical view of the implied volatility smile for each expiration date. It enables you to identify a potentially profitable skew at a glance.
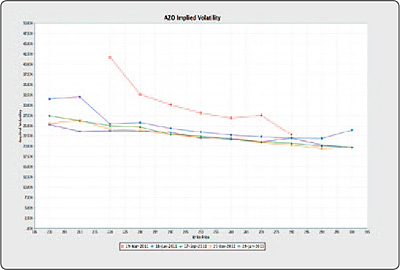
You can select what the chart shows, such as the range of low and high strikes and the IV that is charted – the call IV, the put IV or the average of the call and put IVs.
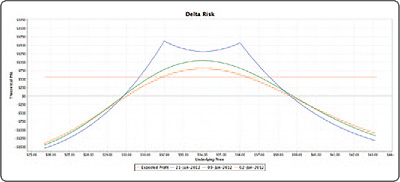
The Expected Return Calculator
The expected return calculator is at the core of the risk analysis capabilities of Option Workbench. Given a specific volatility profile, there are often many strategies that meet a given set of criteria. The expected return calculator gives you a formidable set of tools that enable you to compare and contrast different spreads with respect to potential profit and risk. With the sophisticated volatility scenario analysis tools, you can test your predictions of future volatility and their effect on your strategies.
The Volatility Study
The volatility study provides you with a unique perspective on closing price movement and volatility. Its upper chart displays a traditional close price line graph, augmented with a bar chart that shows how many standard deviations the price changed from the previous close price. The number of standard deviations is calculated based on your choice of the 20-, 50- or 100-day historical volatility.
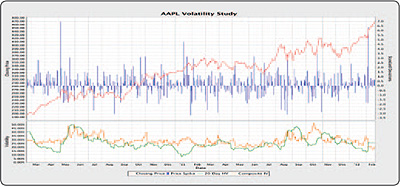
The lower chart shows the time series of the currently selected statistical volatility and the option’s composite implied volatility. Together, these tools constitute a powerful means for analyzing volatility. They give you advanced capabilities to determine the risks associated with different options trading strategies and to find profitable trading opportunities.
Strategy Zone Included
A subscription to Option Workbench includes access to The Strategy Zone database, automatic updates and membership in the LinkedIn Option Workbench group.
If you are currently a Strategy Zone subscriber and convert to Option Workbench we will issue a prorated refund for your remaining Strategy Zone days.
Praise for Option Workbench
Investing today must necessarily integrate volatility. Doing so can be hazardous without the proper tools. Option Workbench is a very useful tool. The data is updated daily and by using some nifty screens, one can address risk and reward in a more predictable fashion. The OWB is a very affordable and valuable tool for the novice or sophisticated investor. I use the OWB as part of my everyday protocol. –
Jeff M., San Jose, CA
If you are serious about trading options, then Option Workbench is mandatory. I simply cannot trade without it now. I find it amazing for comparing annualized returns amongst different trades and strategies. It has slashed my analysis time by 75%. I’m able to accurately assess my risk on all sorts of trades. One can adjust volatility to see “doomsday” scenarios. For all this software delivers, the subscription price is a bargain. Equity, index, and future options are all there! Best options software on the planet. I give Option Workbench my highest recommendation.
Mark B., Seattle, WA
Option Worbkench is not currently available for purchase
Unfortunately, the product is not currently available to new enrollees as the product is undergoing maintenance.
In the meantime, we have formed a relationship with the award winning OptionVue Systems Software. OptionVue has been a leader in developing and providing options trading and analysis software since 1983 and we have always been impressed with the analytics and features in their software.
OptionVue normally offers a 14-day trial, but you can order the special McMillan 30-day trial by clicking the link below:
© 2023 The Option Strategist | McMillan Analysis Corporation