
By Lawrence G. McMillan
This year has been a wild and crazy year in many respects – probably nowhere more than in volatility. That has manifested itself in the trading of $VIX. Over the years, we have sometimes described the seasonality of $VIX. As it turns out, it often follows a very similar pattern (although not completely this year). Moreover, in election years, the pattern is altered in a way that is, perhaps, developing this year as well.
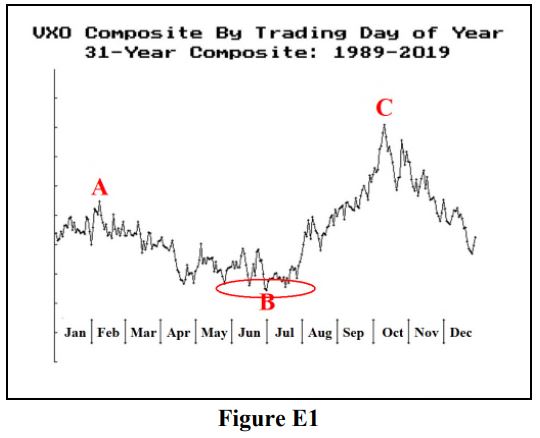
Let’s start out by looking at the seasonality of $VIX over the 31-year period from 1989 through 2019 – that is not including what has happened this year. That data is graphed in Figure E1. For longer-term subscribers, this is a familiar picture: $VIX rises slightly into the spring of the year (point “A”), then declines into the lows of the year. A number of years ago, that low was very typically right on July 1st each year. But in recent years, volatility has been very low for long periods of time (2016, 2017, 2018 – yes, even 2018 – and 2019 all saw very low $VIX readings in May through August...
Read the full article, published on 9/4/2020, by subscribing to The Option Strategist Newsletter now. Existing subscribers can access the article here.

© 2023 The Option Strategist | McMillan Analysis Corporation