By Lawrence G. McMillan
Several times, we have mentioned the fact that in a bear market, there is usually selling in October, followed by a strong October Seasonal rally, and then a failure of that rally in early November. If it is truly a bear market, new lows are made in November or early December.
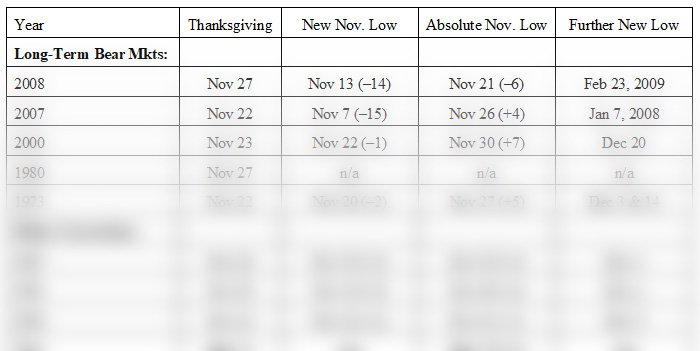
We have conducted more research into this pattern to see if it might have some general tendencies for timing the November lows. First of all, the pattern noted above was very evident in 2000, 2007, and 2008 – all bear market years (or the beginning of bear markets). While there were October declines in 2011, 1990, and 1987, those really weren’t long-lasting bear markets. There was a bear market at the beginning of the Reagan administration, from 1980 – 1982, but it did not fit the pattern we have described. Prior to that, you have to go back to 1973 to find another long-lasting bear market.
The following table shows the November/ December lows, in relation to the Thanksgiving holiday. In each case the date is shown, and the number in parentheses is the number of days between that date and Thanksgiving...

Read the full article, published on 11/16/18, by subscribing to The Option Strategist Newsletter now.
© 2023 The Option Strategist | McMillan Analysis Corporation

