By Lawrence G. McMillan
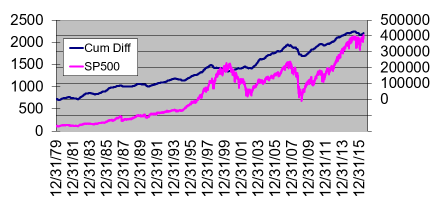
Despite the euphoria about the market breaking out to new highs, accompanied by buy signals from many of our systems, and from our indicators, there is a dark cloud on the horizon. We have often mentioned that “stocks only” breadth has not kept pace – and it’s still not keeping pace. “Stocks only” cumulative breadth (i.e., the daily running sum of advances minus declines amongst all optionable stocks), made a new high in July 2014. It has basically gone nowhere since. $SPX was at 1974 at that time. Oh, yes, it eked out a slightly higher high in April 2015, but that was only by a few issues. Meanwhile, $SPX had risen to 2112 by that time. Now, $SPX is at even higher highs, and “stocks only” cumulative breadth is below those April 2015 highs. Since Brexit, “stocks only” breadth has been terrific, though, and it’s only a couple of thousand issues below its all-time high. Even so, $SPX has advanced nearly 200 points since July 2014, and cumulative breadth is essentially unchanged,. That’s a negative divergence.
By the way, NYSE breadth does not show this divergence, nor does the $SPX 1500 cumulative breadth. But I feel that our “stocks only” calculations take in a wider array of stocks, and I trust it more than those...

Read the full feature article (published 7/15/16) by subscribing to The Option Strategist Newsletter.
© 2023 The Option Strategist | McMillan Analysis Corporation

