By Lawrence G. McMillan
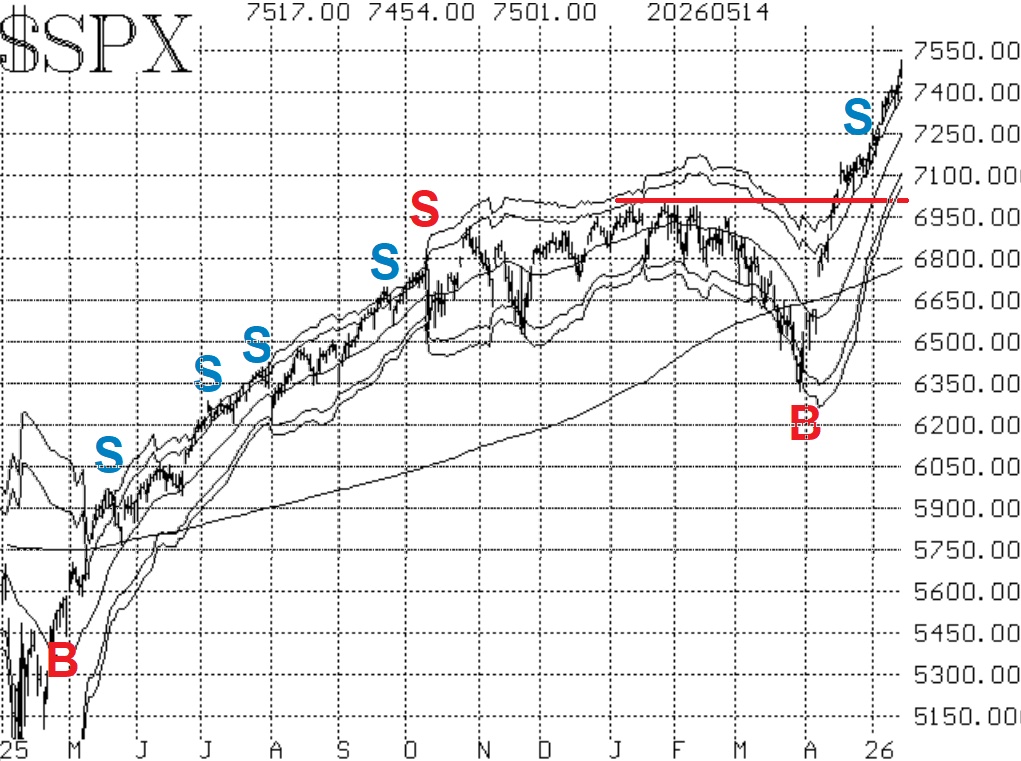
$SPX continues to surge, having made new all-time highs on four or the last five trading days. There is minor support at 7338 (the past week's low), and at 7275 (the bottom of the most recent gap on the $SPX chart). Stronger support might be found in the 7050-7175 area, and then there should be solid support at 7000.
Equity-only put-call ratios continue to fall, since there has been heavy call buying accompanying this rally. They have reached overbought states -- especially the weighted ratio (Figure 3), which is now down to levels last seen in November 2021. The standard ratio (Figure 2) is low as well, but not as low as that.
Both breadth oscillators are now on sell signals. These are our shortest-term indicators, and they are thus subject to whipsaws. This is the first sell signal we've seen since March.
$VIX has remained a bit elevated. Normally we would expect to see $VIX in the 14-15 area after a string of new all-time highs such as $SPX has posted. The fact that $VIX is mostly in the 17-18 area indicates that some large traders are still bidding up $SPX puts (which elevates $VIX), and they are thus hedging themselves in case something bad happens.
The $SPX chart remains solidly bullish, and that is probably the main thing to keep in mind. We are beginning to see some potential sell signals (only one is confirmed so far), though, and we will act on those. It is important to keep rolling deeply in-the- money options, for the market can reverse quickly.
This Market Commentary is an abbreviated version of the commentary featured in The Option Strategist Newsletter.

© 2023 The Option Strategist | McMillan Analysis Corporation