By Lawrence G. McMillan
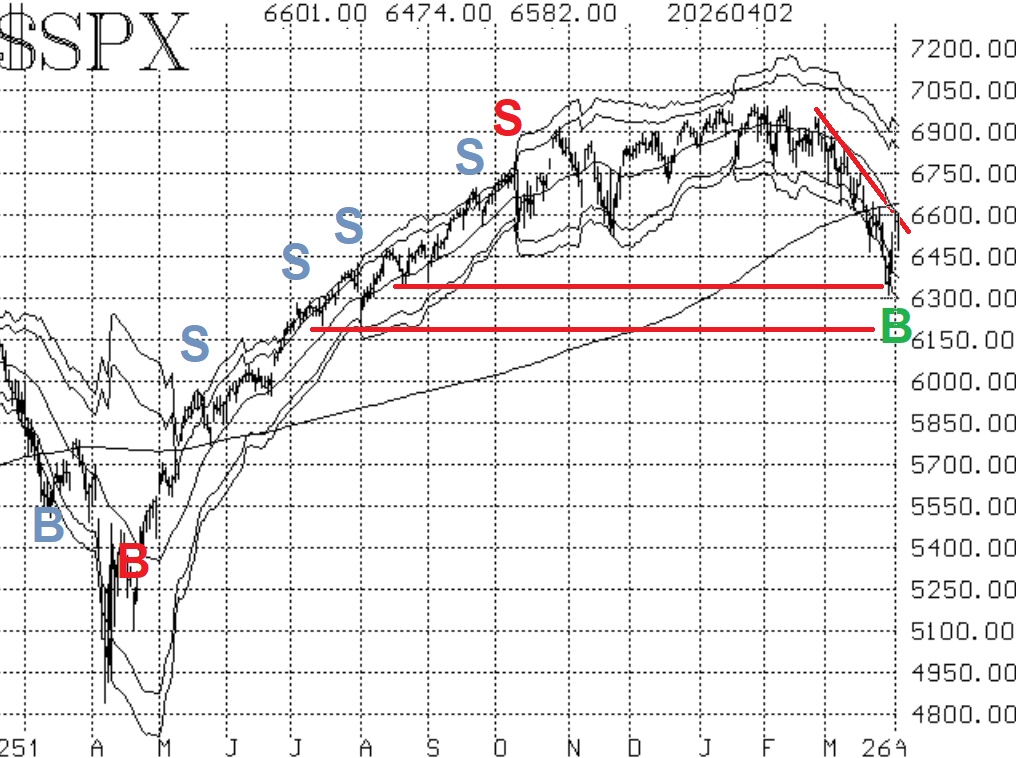
Volatility continues to be elevated both in terms of realized and implied. $SPX dropped sharply early in the week as various support levels gave way on the $SPX chart. Of primary concern was the violation of the 6475-6550 support area. Eventually, $SPX bottomed on Tuesday, with a low near 6330 which was also a minor low last August. There should also be support near 6200 (the lows of last July).
The rally (so far) reached as high as 6610. There are a number of potential resistance points in that area. First is the 200-day Moving Average, which $SPX is now approaching from below. Perhaps more important is the declining 20-day Moving Average, which is typically our target for the extent of an oversold rally. The 20-day MA has just crossed below the 200-day MA and is at about 6600. In addition, throughout March there were several days where the daily high or low was in this area as well. All of these are technical resistance points.
The first confirmed buy signal a McMillan Volatility Band (MVB) buy signal was confirmed on April 1st (green "B" on the chart in Figure 1).
Equity-only put-call ratios have continued to climb or at least remain in an uptrend, even though $SPX has rallied. The standard ratio (Figure 2) continues to make new relative highs. That perpetuates a bearish stance for stocks.
Breadth has improved quickly over the past three days. The fact that breadth was positive on Thursday April 2nd, after the market opened 100 points lower, is impressive. Both breadth oscillators are now on confirmed buy signals as of April 2nd.
$VIX has continued to spike up and down. It rose above 31 again this week, but closed near 24. $VIX remains in an uptrend, so the trend of $VIX sell signal is still in place. There have been repeated "spike peak" buy signals, but we are waiting for confirmation from the "construct" of volatility derivatives. So far that "construct" remains bearish
This 3-day rally has empowered the bullish forecasters. One more frequently hears "This market wants to go up" (a vintage saying from the bulls), or "this market didn't decline that much" (they are right about that -- not even 10%). But the same things were being said last year at the beginning of April 2025 and then the market took a tremendous hit on news of tariffs. Not to necessarily say that news will drive the market down again but it certainly could. So, we prefer to stick with the technicals, waiting for confirmed buy signals (and thus not picking the exact bottom of the market). $VIX and the equity-only put-call ratios began to rise well in advance of the current market decline, and they are still advancing. I would think we'd to see a halt in their advances before turning too bullish.
This Market Commentary is an abbreviated version of the commentary featured in The Option Strategist Newsletter.

© 2023 The Option Strategist | McMillan Analysis Corporation