By Lawrence G. McMillan
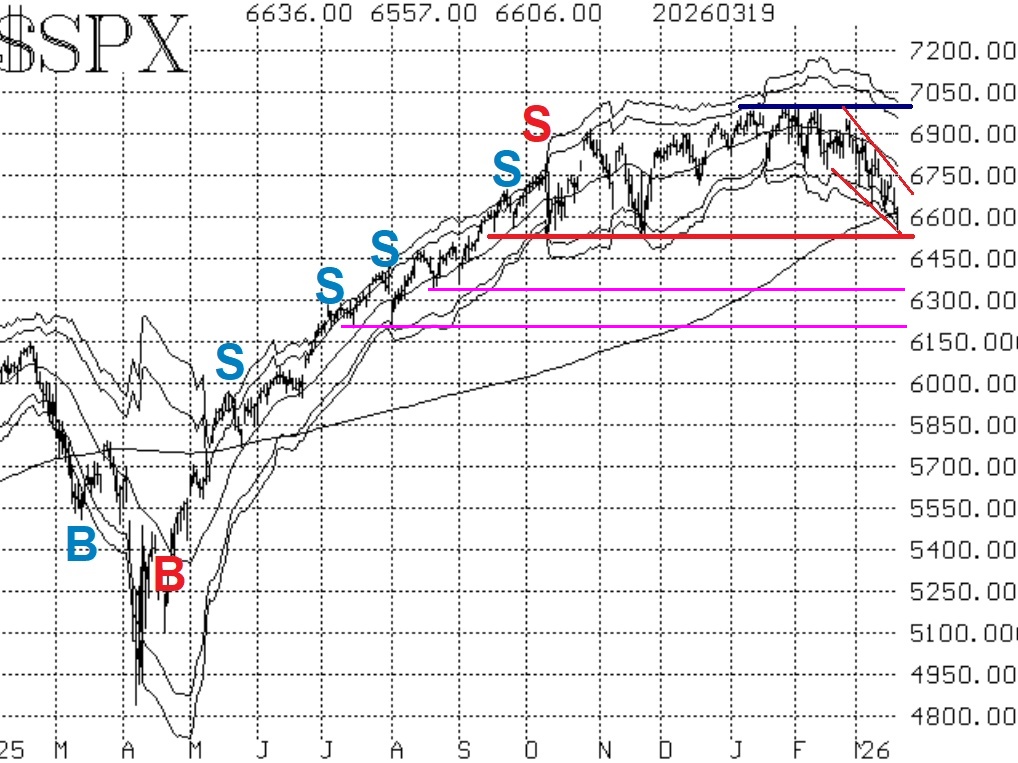
The downtrend on the $SPX chart is obvious, even to the casual observer. Not only are there now lower highs and lower lows, but the short-term moving averages as well as the "modified Bollinger Bands" are all sloping downwards.
$SPX is now probing below its 200-day moving average and appears ready to test support in the 6500-6550 support for the first time since last November. If that is violated, then there is tentative support in the 6350 area (lows of last August), and probably more likely in the 6200 area (lows of last July).
Overhead, there is resistance all over the place. Even if an oversold rally springs up again (as it did this past Monday and Tuesday), it would run into resistance at the declining 20-day moving average.
Equity-only put-call ratios attempted to curl over to buy signals, but they were ultimately not able to do so. Hence, they remain bearish for stocks.
Market breadth has generally been terrible. Yes, there were a couple of positive breadth days during the oversold rally early this week, but that was not enough to move the breadth oscillators out of their sell signals.
$VIX has been climbing since late December and continues to rise. The trend of $VIX sell signal (pink "S" on the chart in Figure 4) remains in place.
In summary, the picture is negative. However, if we were to obtain confirmed buy signals we would take them. As it is, continue to roll deeply in-the-money positions.
This Market Commentary is an abbreviated version of the commentary featured in The Option Strategist Newsletter.

© 2023 The Option Strategist | McMillan Analysis Corporation