By Lawrence G. McMillan
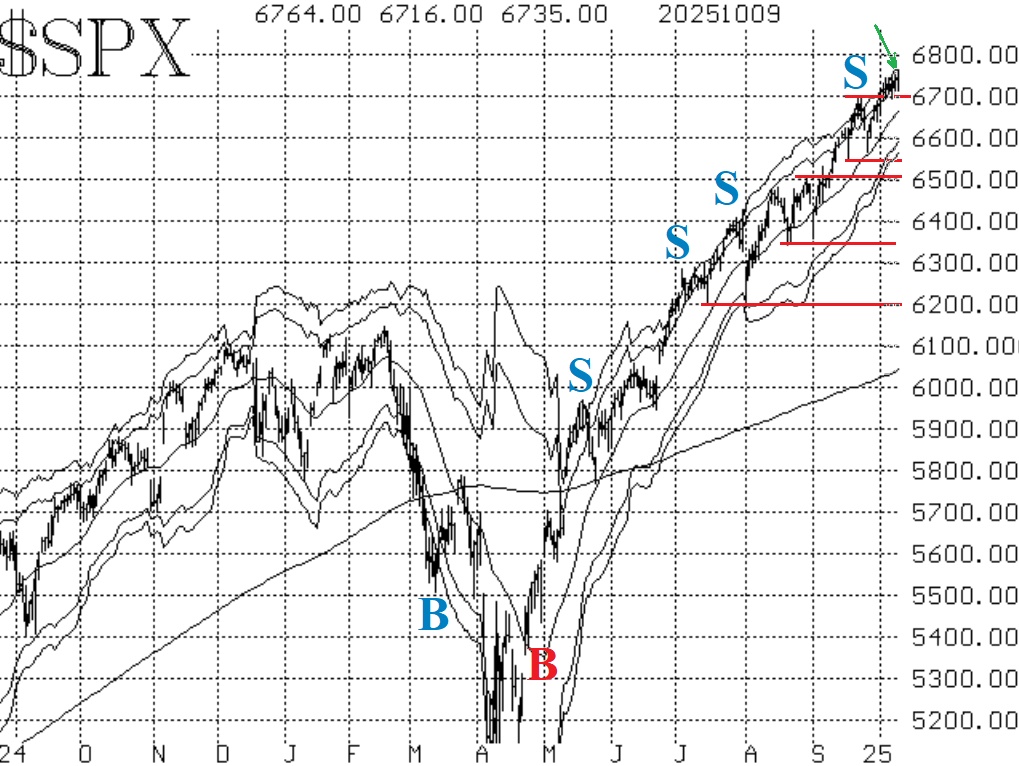
Stocks continue to move higher, with $SPX making new all- time highs nearly every day. This has produced some overbought conditions, which we will discuss, but the $SPX chart remains strong. There is now a support area at 6700 (the September highs which were tested successfully as support this week). Below that, the previous support areas are still there as well: 6550, 6500, 6340-6360, and 6200. All of these are marked with red horizontal lines in the chart in Figure 1. Personally, I think if $SPX traded below 6500, that would be psychologically bearish and would bring in heavier selling.
Meanwhile, equity-only put-call ratios continue to decline. As long as they are declining, that is bullish for stocks in general. So, these are overbought, but they won't be on confirmed sell signals until the ratios roll over and begin to trend higher.
Breadth has been poor, at least breadth measured in issues, which is the traditional way. The NYSE breadth oscillator has been on a sell signal for a couple of weeks now, and the "stocks only" oscillator isn't much better as it flips back and forth between a sell signal and a stop-out. Normally, breadth would be much better when $SPX is constantly making new all time highs. The fact that it isn't is a warning sign, but so far hasn't had much affect.
New Highs on the NYSE continue to dominate New Lows. They are also equally dominant in NASDAQ terms or in "stocks only" terms. This indicator gave a buy signal back in June, and it is still in place. It would only be stopped out if New Lows outnumbered New Highs on the NYSE for two consecutive days.
Implied volatility (i.e., $VIX) has remained subdued so far, but it is beginning to pick up as I am writing this. As long as $VIX remains below its 200-day Moving Average (currently just above 19), the trend of $VIX buy signal for stocks remains intact. It would take a close above that 200-day MA for two consecutive days in order to stop out that buy signal.
In summary, the $SPX chart remains bullish and so do many of our indicators. With the market selling off today, we may get some new confirmed sell signals from our indicators, which we would act on. Regardless, continue to roll deeply in-the-money options.
This Market Commentary is an abbreviated version of the commentary featured in The Option Strategist Newsletter.

© 2023 The Option Strategist | McMillan Analysis Corporation