By Lawrence G. McMillan
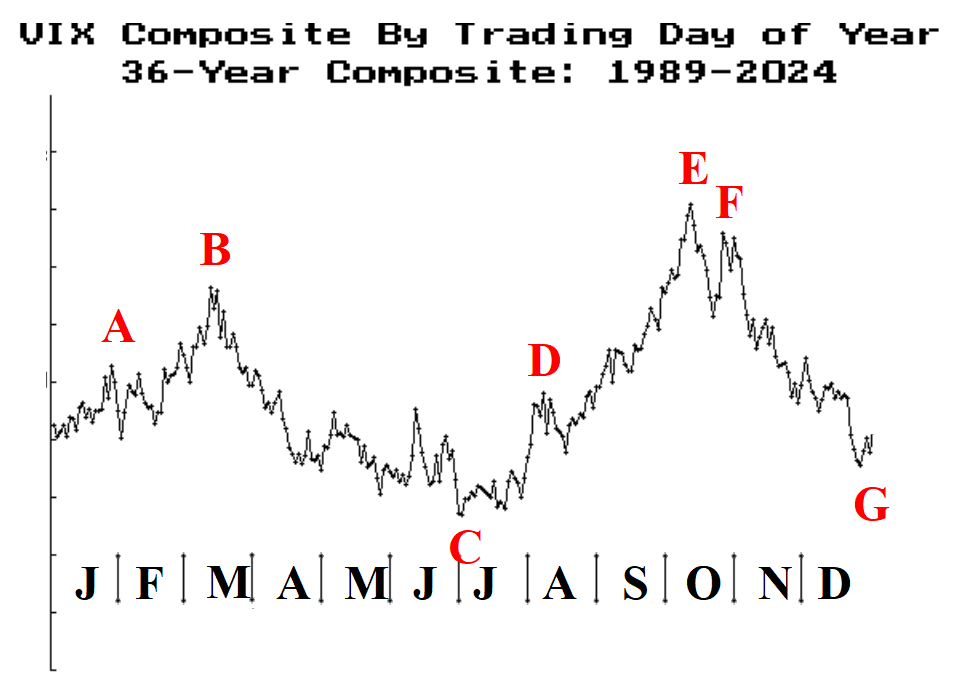
Periodically we publish the chart below, which shows the $VIX composite from 1989 through some more current date – 12/31/24 in this case. We usually update this chart annually, because it is meant to give some insight as to where $VIX goes at what time of the year.
There are four distinct trends on the chart. 1) First, volatility rises from the first of the year through mid-March. 2) Then it begins a decline towards the lows of the year, which it reaches in July. For a long while, the yearly low was almost exactly at July 1st, but in recent years, the lows of the chart have extended all the way through the month of July.
3) From there, $VIX begins to climb towards its yearly years, which are typically registered in October, when the stock market takes a big tumble. 4) After that, volatility declines rather sharply into year-end.
Since this is a composite chart, each individual year is going to be somewhat different that this. But it is a good roadmap as to what to expect in general.
In 2024, the yearly high was that huge spike in August, so the yearly peak occurred then, not in October. But overall, 2024 was not far from the composite “norm.” For example, the 2024 lows for $VIX were all throughout the June-July period.
This year’s $VIX data is not yet incorporated into the composite chart shown above. The $VIX chart, so far in 2025, is below...
Read the full article by subscribing to The Option Strategist Newsletter now. Existing subscribers can access the article here.

© 2023 The Option Strategist | McMillan Analysis Corporation