By Lawrence G. McMillan
There has been a good deal of talk in option and other trading circles lately about how high realized volatility is, even though implied volatility has begun to taper off. Which one is “right?”
Is the fact that realized volatility remains high a danger sign? Even the bulls had to be a bit surprised by the 220-point rally from Wednesday’s lows to Thursday’s highs in just a few hours of trading. Yes, they liked it, but there is something uncomfortable about seeing moves of that size in either direction in so little time. On the other hand, if $VIX is declining and is well below the historical volatility, perhaps it’s leading the way and saying that all is well. Jump back in.
If we look at these separately, it’s difficult to make sense of things. But in this article, we’re going to look at the difference between $VIX and the 20-day Historical Volatility of $SPX (HV20). It turns out that there is some significant information to be gained, and perhaps a solid trade can be employed eventually.
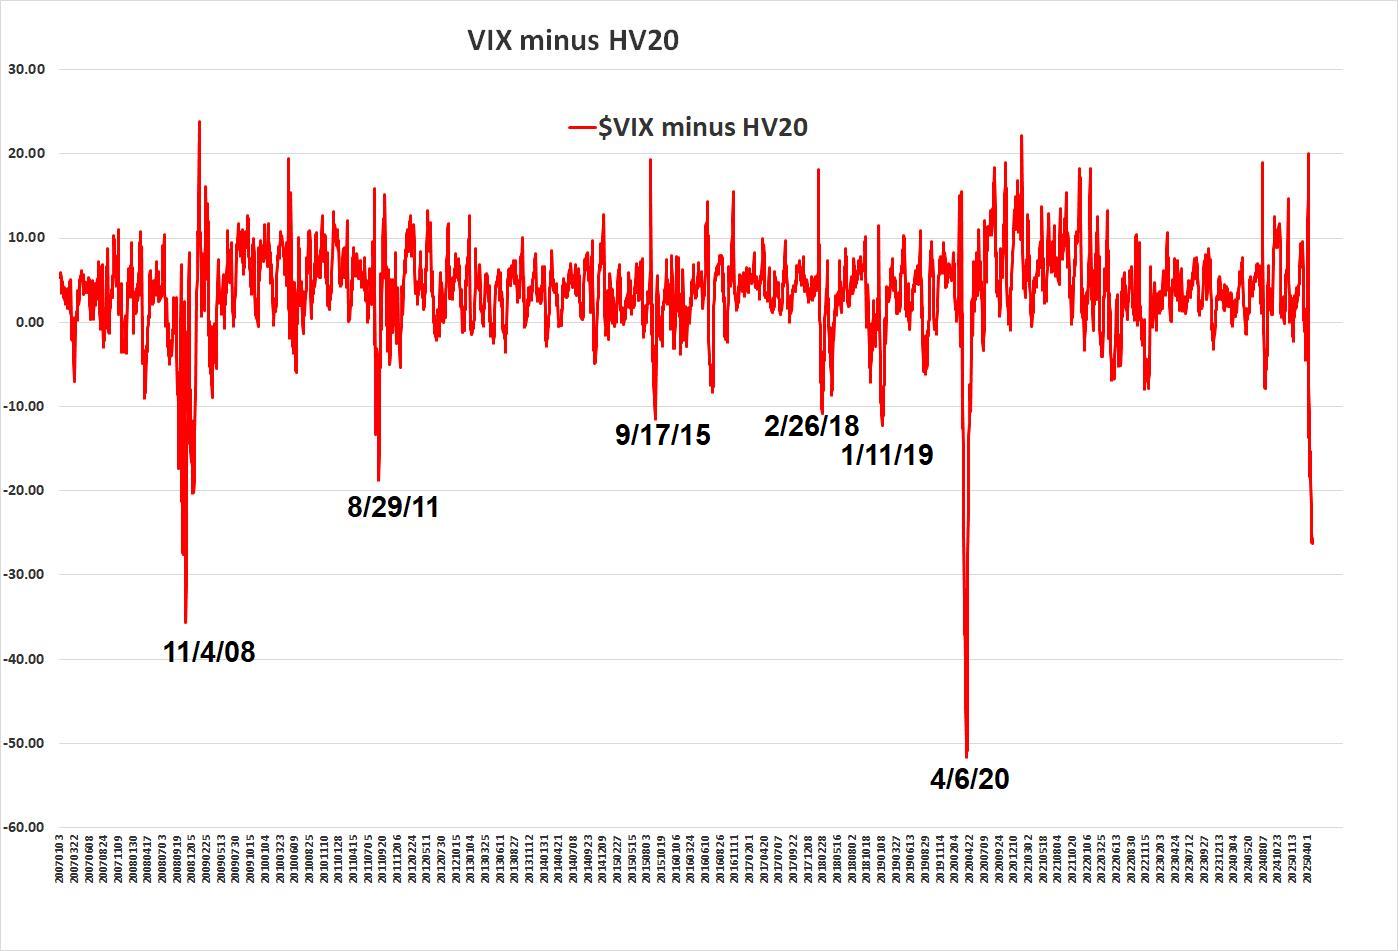
There have been only a few times in history when HV20 rises enough to get 10 points above $VIX. Some of those occasions, though, have lasted for quite a while, and sometimes the market can fall precipitously while this condition exists. I liken it to an oversold condition for the stock market: eventually the market will rally, but you probably want to exercise extreme caution when HV20 is more than 10 points higher than $VIX.
The chart above shows the difference of $VIX minus HV20, from 2007 until today.
During this time, there have only been seven times when HV20 has climbed to a level more than 10 points above $VIX. The dates of the extremes are shown on the chart. However, one would not be able to buy the market on those dates, because there would be no way of knowing that was the “bottom.” Rather, it would probably be best to wait for...
Read the full article by subscribing to The Option Strategist Newsletter now. Existing subscribers can access the article here.

© 2023 The Option Strategist | McMillan Analysis Corporation