By Lawrence G. McMillan
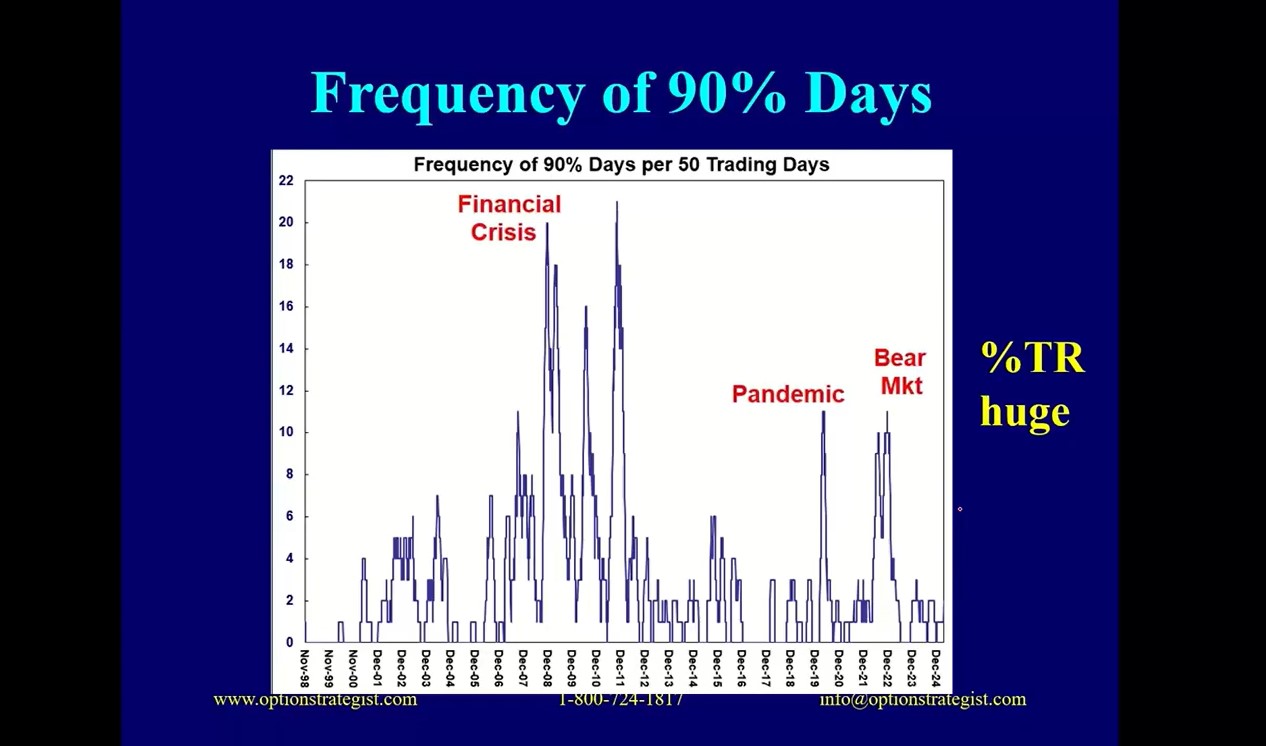
Last week, the market experienced both a 90% down day and a 90% up day—an uncommon and potentially concerning combination. These “90% days,” defined by extreme imbalances in advancing vs. declining stocks or volume, often appear during periods of market stress or transition.
In this update, I walk through a chart tracking the frequency of 90% days over a rolling 50-day period and explain why an uptick in this measure is worth watching closely. I also discuss the recent spike in S&P 500 true ranges—daily price swings exceeding 300 to 400 points—and what that suggests about market sentiment and structure.
While we're not in crisis territory yet, history shows that a clustering of these signals has often preceded significant market declines. Watch below:
© 2023 The Option Strategist | McMillan Analysis Corporation