By Lawrence G. McMillan
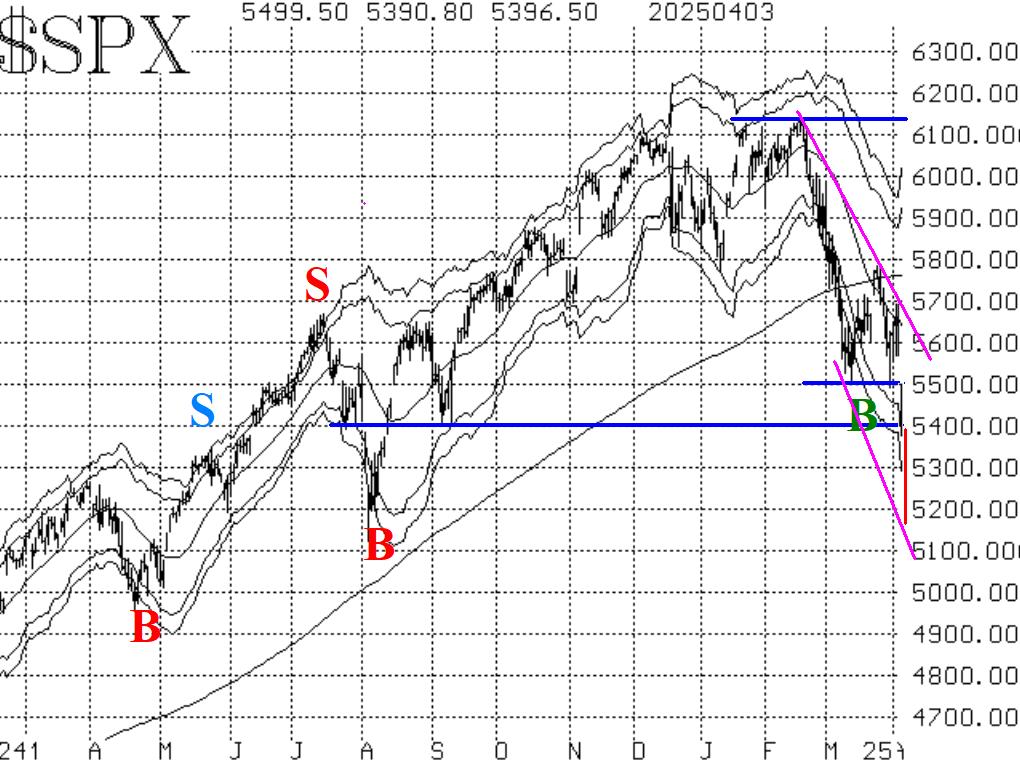
What had been a mediocre, oversold rally failed right where such rallies normally do -- at the declining 20-day moving average. It just so happened that the 200-day moving average of $SPX was in the same area. That was just over a week ago. Then, $SPX quickly declined to the lower edge of the trading range (near 5500) and found support once again.
But all of this changed to a much more bearish scenario after President Trump's announcement of tariffs. Prior to that announcement, the market seemed ready to rally, but in the mere 36 hours since that announcement, $SPX (or the S&P futures) lost 530 points. The red line on the $SPX chart in Figure 1 is where the S&P futures traded overnight on Thursday night, and in particular on Friday morning prior to the NYSE opening. The magnitude of the decline is shocking especially when one considers the fact that the tariff announcement was about what President Trump had said all along it would be.
Now, we are seeing indicators smashing down into oversold territory, but "oversold does not mean buy." The market can remain oversold for long periods of time while it is declining sharply. So, we will have to wait for confirmed buy signals, rather than trying to pick a bottom in front of this bearish freight train.
This move downward has established a pattern of lower highs and lower lows on the $SPX chart (pink lines on the chart in Figure 1). That is bearish, and might even be the beginning of a bear market although it's probably too soon to be able to declare that. In any case, a "core" bearish position is warranted as long as this downtrend is in force. A move above 5800 -- or perhaps even 5700 -- would probably be enough to break the downtrend, but that seems difficult to achieve after the demolition that has taken place.
Equity-only put-call ratios have both moved to new relative highs. This cancels out the potential buy signal from the weighted ratio (the standard ratio never did have a potential buy signal). Both ratios now will need to roll over and begin to trend downward in order for buy signals to be established. That won't happen immediately.
Breadth has been terrible the last two days, and it looks like April 4th will be a 90% down day. The breadth oscillators are deeply in oversold territory, and so is the oscillator differential. But none of these will generate buy signals until breadth begins to improve and it will take more than one or two days of positive breadth for that to occur.
Both realized and implied volatility are now exploding. $VIX was sort of late to the game, but I've drawn today's price action on the chart in Figure 4, and you can see that $VIX is much higher, finally. The $VIX futures are higher, too, but are trading at large discounts to $VIX. That alone will set up the $VIX/SPY call hedge. Also, a "spike peak" buy signal will eventually come along in $VIX, too, and probably sooner rather than later.
So, we are watching for confirmed buy signals, or even oversold conditions that abate and present short-term buy signals. Be sure to roll deeply in-the-money options. With puts being so expensive, you are not receiving a large credit on rolling down, but it still needs to be done.
This Market Commentary is an abbreviated version of the commentary featured in The Option Strategist Newsletter.
© 2023 The Option Strategist | McMillan Analysis Corporation

