By Lawrence G. McMillan
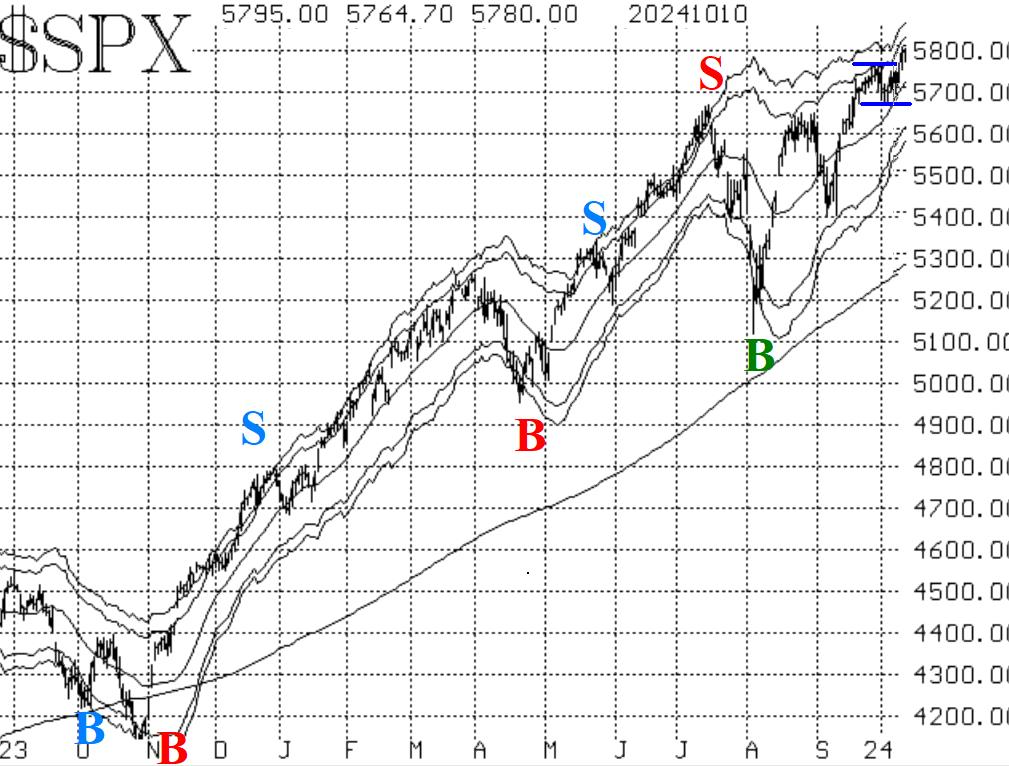
After breaking out decisively to new all-time highs in mid- September, $SPX was having some trouble after that. It had been mired in a trading range between 5670 and 5770 for nearly three weeks. But this week, on October 9th, $SPX broke out again to new all-time highs, and it's pressing further to the upside today (October 11th).
Chart-wise, this is strongly bullish action and thus dictates that we maintain a "core" bullish position. Despite, the bullishness of the chart, there are issues with some of the other indicators, but we'll discuss those shortly.
So, once again there is no overhead resistance. We often look to the +4 sigma "modified Bollinger Band" (mBB) as a target in that case. That Band is currently at 5850 and still rising.
There is now support at 5770, and then below that at 5670. A close below 5670 would be cause to relinquish the "core" bullish position.
Equity-only put-call ratios have continued to plunge. That's because put buying has dried up to a large extent, while call volume is increasing. In addition, some rather large numbers from 21 trading days ago (early September) have come off the moving averages. So, these ratios remain on buy signals.
Breadth has been poor. The large number of recent negative breadth days has rolled the oscillators over to sell signals. For now, $SPX is ignoring this, but this is evidence that the broad market is not following along so easily with $SPX.
$VIX has continued to be fairly elevated. Part of the reason is that, for the first time, the $SPX options expiring just after the election have become part of the calculation of $VIX (since they are less than 30 calendar days in the futures). Those options are inflated in implied volatility, as we have been pointing out for months. That pushed $VIX up to 23.14 at its highest point this week. Thus, $VIX remains in "spiking" mode as it continues to move higher. The trend of $VIX sell signal remains in place because $VIX is well above its 200-day Moving Average. That 200-day MA is currently at 15.10 and rising slowly.
We are maintaining a "core" bullish position because of the positive nature of the $SPX chart. We will trade other confirmed signals around that and we will continue to take partial profits by rolling deeply in-the-money options upwards.
This Market Commentary is an abbreviated version of the commentary featured in The Option Strategist Newsletter.

© 2023 The Option Strategist | McMillan Analysis Corporation