By Lawrence G. McMillan
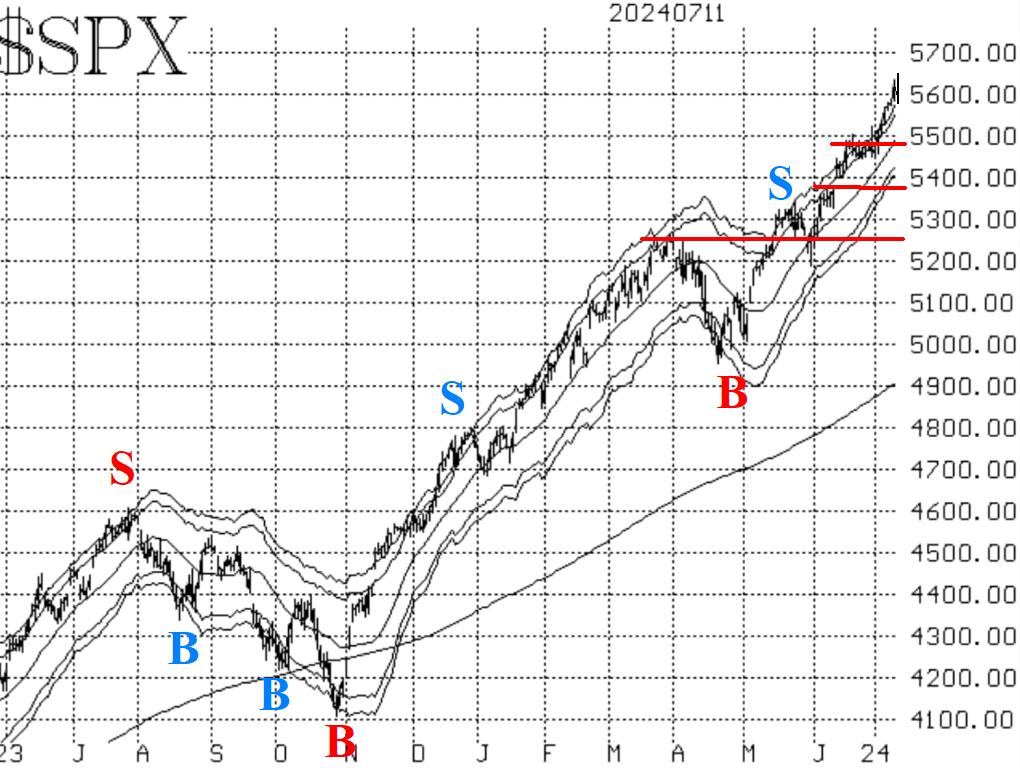
The market continues to trade higher, and the pace is accelerating. Moreover, the euphoria that has been enjoyed by $SPX now seems to be spilling over into the small-caps such as the Russell 2000 Index ($RUT; IWM). The inclusion of the small-caps has expanded breadth, so that is no longer a negative divergence. In fact, Cumulative Volume Breadth (CVB) has been making new all-time highs right along with $SPX -- almost every day in July. This is no longer just a NVIDIA (NVDA) market.
Equity-only put-call ratios continue to make new relative lows, the lowest we've seen since the last bull market ended in late 2021. But, as you see in Figure 2, concerning July 2023 or March 2024, they can shuffle along at low levels, while the stock market continues to rise. Thus, the mere fact that they are this low means only that they are overbought -- this is not a sell signal. A sell signal will occur, when they start to rise sharply from these lows.
As noted earlier, market breadth has improved significantly with the participation of the small caps coming into the market. Both breadth oscillators remain on buy signals, and finally they are both in overbought territory. It was late in coming, but it finally happened.
$VIX continues to trade at very low levels. Stocks can continue to rise while that is the case. The trend of $VIX buy signal that was generated back in March (circled on the chart in Figure 4) is still place. The first signs of caution would appear if $VIX were to rise above its 200-day Moving Average, which is at 14.40 and beginning to decline again.
We continue to maintain our "core" bullish position and several other related long positions based on buy signals from various indicators. We will trade any other confirmed signals around our "core" position. We have also been rolling calls up to higher strikes when they get deeply in-the-money.
This Market Commentary is an abbreviated version of the commentary featured in The Option Strategist Newsletter.
© 2023 The Option Strategist | McMillan Analysis Corporation

