By Lawrence G. McMillan
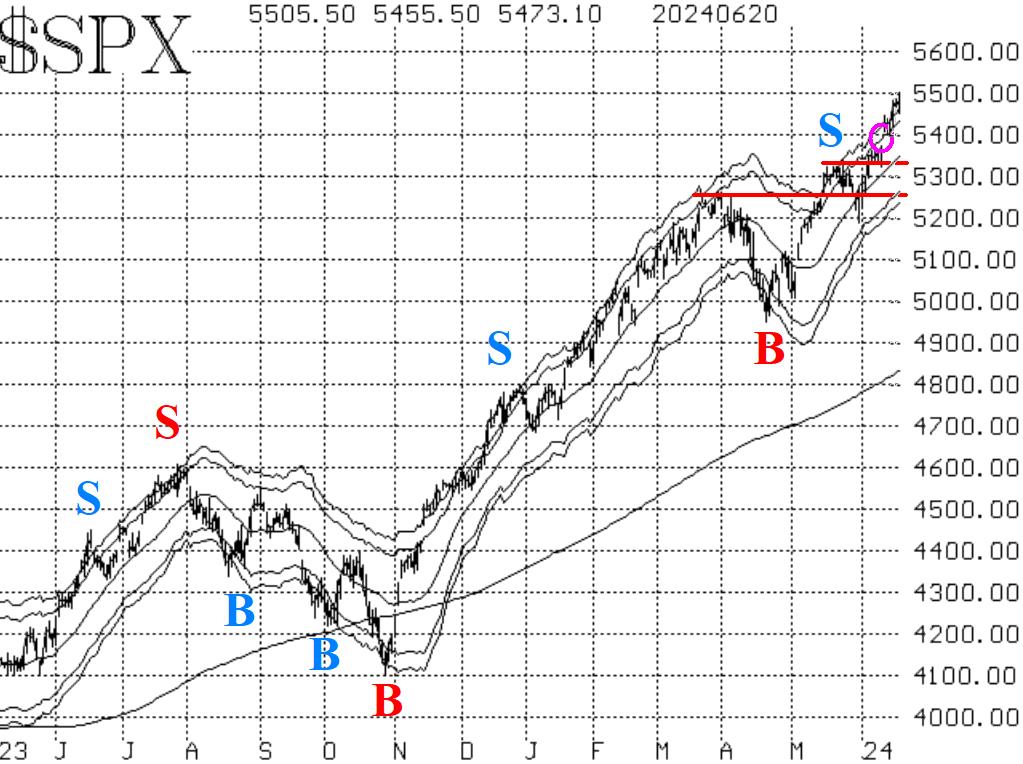
If you measure the stock market by $SPX, it's doing great. $SPX has closed at a new all-time high on seven of the last eleven trading days. Some other indices, and market internals, are not doing as well; we'll get to that shortly. As for $SPX, there is support at 5400, 5330, and 5260. There is also a gap (circled on the chart in Figure 1), which would be closed if $SPX were to trade down to 5350. Any and all of those levels could be tested, and it wouldn't be a problem for the overall bullish trend. A close below 5260, though, would be a change of trend, in my opinion.
Equity-only put-call ratios remain on buy signals for stocks, although they are in a very overbought state, and the computer analysis programs are calling for sell signals. We would need to see visual confirmation of an upturn in the weighted ratio before declaring that these ratios are on sell signals for stocks.
Market breadth has not been strong. That is not a good sign when $SPX is making new all-time highs. In fact, it is a divergence, and that can eventually lead to trouble. For the record the breadth oscillators are managing to cling to buy signals at this time.
$VIX remains subdued, so the trend of $VIX buy signal for stocks is still in place. It would be stopped out if $VIX were to close above its 200-day Moving Average for two consecutive days. That MA is at 14.50 and still slowly declining. The fact that $VIX is so low is another overbought condition, but it won't be a sell signal until $VIX begins to rise (sharply).
We continue to maintain a "core" bullish position because of the positive nature of the $SPX chart. Yes, there are some overbought conditions and some divergences, but there are no confirmed sell signals at this time. We will trade any confirmed signals around that "core" position.
This Market Commentary is an abbreviated version of the commentary featured in The Option Strategist Newsletter.
© 2023 The Option Strategist | McMillan Analysis Corporation

