By Lawrence G. McMillan
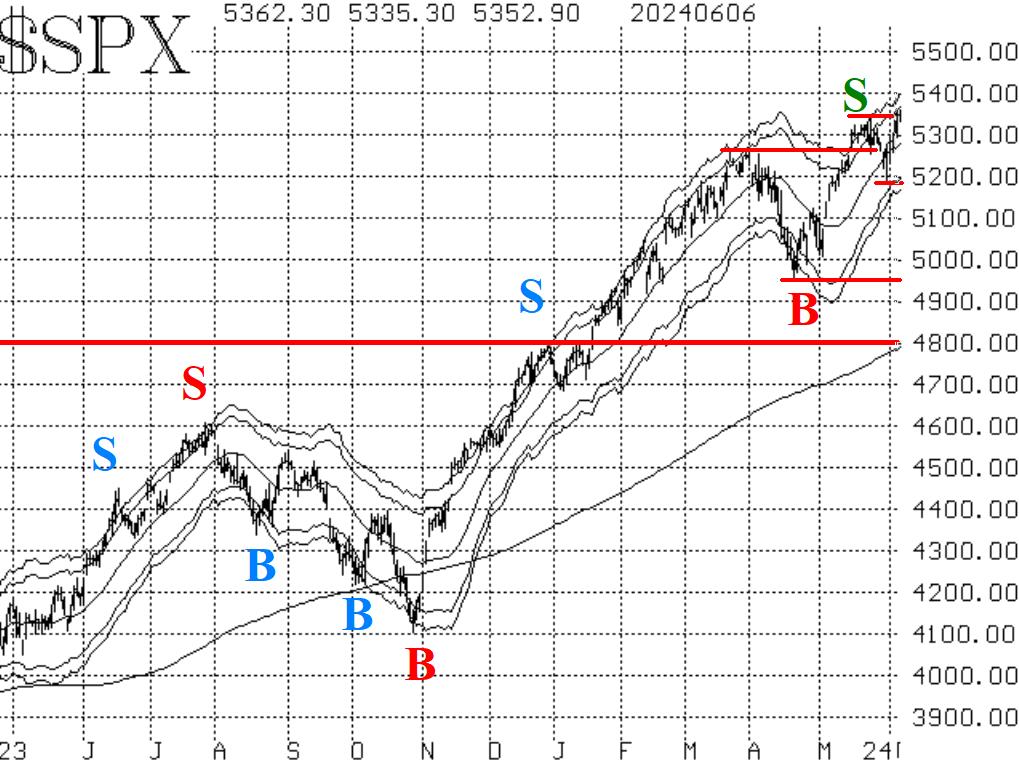
Just a week ago, $SPX had broken down below support at 5260, and it seemed like the bears might be flexing their muscles. But it was a weak decline, which abruptly turned around on May 31st. $SPX quickly reached new all-time closing and intraday highs above 5340, and has been able to hold the new highs for two consecutive days. Thus, the $SPX chart is bullish, and that calls for a "core" bullish stance.
There is support at or just below the previous highs, generally from 5260 to 5340. A close back below 5260 would be quite negative, for the prospect of this recent move to new highs being a false breakout would arise at that time.
Equity-only put-call ratios continue to decline. That is bullish for stocks. It is worth noting that these ratios did not change direction at all when $SPX sold off a week ago; they have remained steadfastly on their buy signals throughout. Now, they are reaching the lower levels of their charts, which is an "overbought" condition for stocks. But it is not a sell signal. A sell signal will not arise until these ratios roll over and begin to trend higher.
Breadth has been "okay." The breadth oscillators rolled over to buy signals a week ago -- at the close of trading on May 31st -- and breadth has been just strong enough since then to maintain those buy signals. With $SPX breaking out to new all-time highs, we would expect to see breadth stronger than it is.
$VIX has fallen back to nearly its lows. Thus the trend of $VIX buy signal that was established when the 20- day MA crossed below the 200-day MA remains in place (circled area on the chart in Figure 4). While a low $VIX is an overbought condition for stocks, it is not a problem for the stock market until $VIX begins to rise sharply. The warning sign of any significant kind would be if $VIX were to close above its 200-day Moving Average.
So, we are holding a new "core" bullish position, in line with the bullishness of the $SPX chart. We will trade all the other confirmed signals that we get, around that "core" position. Currently, most of those signals are bullish, but things have a way of changing quickly.
This Market Commentary is an abbreviated version of the commentary featured in The Option Strategist Newsletter.
© 2023 The Option Strategist | McMillan Analysis Corporation

