By Lawrence G. McMillan
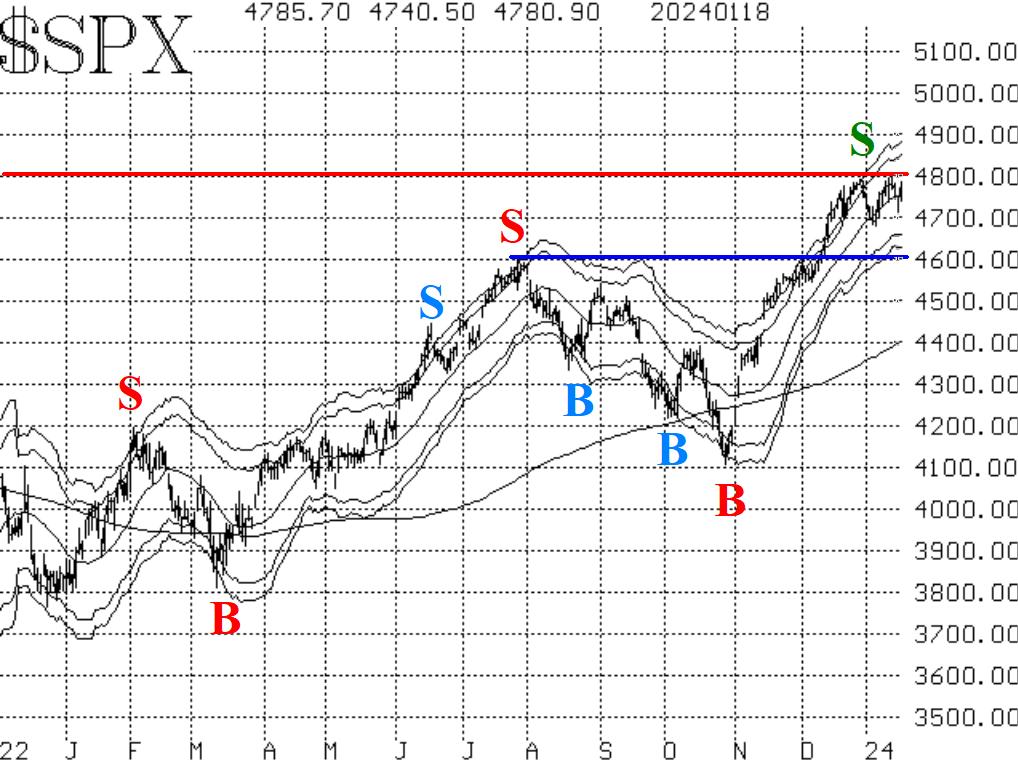
Despite more deterioration in the internal indicators (put-call ratios, breadth, New Highs vs. New Lows), $SPX has not weakened much and remains near all-time highs. Both the NASDAQ-100 ($NDX) and the Dow ($DJX) have already made new all-time highs, but they are dealing with resistance at current levels as well. A clear upside breakout over 4800 by $SPX would be very bullish. Meanwhile, there is support just below 4700 (the early January lows), with stronger support at 4600. A close below 4550 (December's lows) would be very negative, though, and might indicate the start of another bear market should it occur.
Equity-only put-call ratios (Figures 2 and 3) continue to rise, and that is a bearish sign for stocks. They will remain bearish until they roll over and being to decline. Since they were just at the lows on their charts, it doesn't seem logical that they would roll over yet. So, these sell signals may be a drag on the market for a while.
Market breadth has continued to be mostly poor. The breadth oscillators are on sell signals, and this week they descended into deeply oversold territory -- especially the "stocks only" oscillator. Readers might recall that these oscillators were overbought in late December, so they have gone from that overbought state to the current oversold state, even though $SPX has not declined much at all. This might be an example, of the market having an internal correction, which is not particularly evident in Index prices, but will eventually be a bullish factor when buy signals are confirmed at a later date.
$VIX remains subdued, but not quite as subdued as it has been. This week, $VIX probed up to nearly touch its declining 200- day Moving Average, but then quickly fell back again. Thus, the trend of $VIX buy signal remains in place.
In addition, it would be somewhat negative for stocks if $VIX were to enter "spiking" mode. When $VIX is in spiking mode, stocks can fall sharply, but eventually a "spike peak" buy signal will occur.
Seasonality is still a factor, too. There is a general negative seasonality from the 8th to the 18th trading day of January, and then a strong positive seasonality commences on the 18th trading day and continues into early February.
In summary, we are continuing to maintain a "core" bullish position because of the generally positive nature of the $SPX chart. We are trading other confirmed signals around that core.
This Market Commentary is an abbreviated version of the commentary featured in The Option Strategist Newsletter.
© 2023 The Option Strategist | McMillan Analysis Corporation

