By Lawrence G. McMillan
After we last published The Option Strategist Newsletter, volatility spiked sharply higher for one day and then plunged. The plunge coincided with the passage of the temporary measure to avert the fiscal cliff, and the stock market exploded to the upside. The resulting spike peak in $VIX was a buy signal for stocks. However, $VIX is now quite low, and other volatility measures have been dragged down as well.
The result of this sharp upward and then sharp downward swing in $VIX and its derivatives shows up in the table on the far right, where 20-day historic volatilities are much higher than they have been for months now.
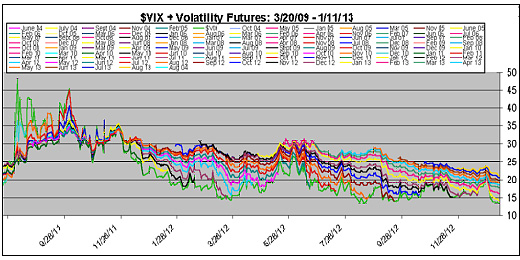
The chart below shows that $VIX futures have dropped sharply as well, at least in the front end of the term structure. Farther-out months only dropped a bit, so that the term structure has widened out again. The green line shows $VIX at new lows (the lowest since July of 2007).

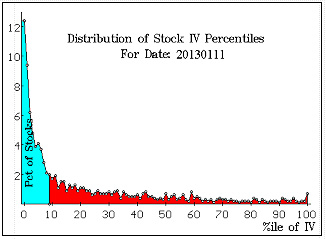
 One of those measures is the Composite Implied Volatility (CIV). We compute CIV for each stock with options and then calculate the average stock’s percentile of CIV. The chart on the right shows the current distribution of the stocks’ CIV’s. The average CIV is now the 9th percentile – an extremely low reading, and the precursor to a sell signal for the broad market.
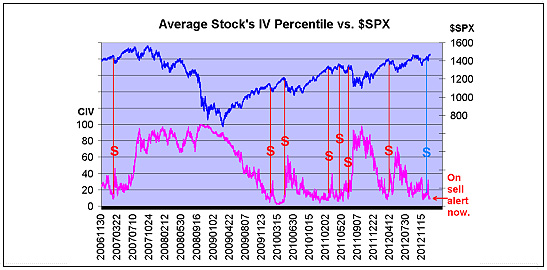
The chart below shows the average percentile of CIV, along with $SPX, going back to 2006. When the average percentile falls below the 10th and then rises above the 17th, a major sell signal is issued for stocks. All of the signals shown were successful ones, save the last one, issued in mid-December (unless you count that slide in late December, which I don’t – it wasn’t large enough to be an “intermediate-term” sell).

It is unclear how long it’s going to take for the current sell signal to mature, so the stock market could continue to rally, keeping $VIX and the CIV average percentile depressed, but suffice it to say that a sell signal is coming as soon as volatility begins to lift.
© 2023 The Option Strategist | McMillan Analysis Corporation

