By Lawrence G. McMillan
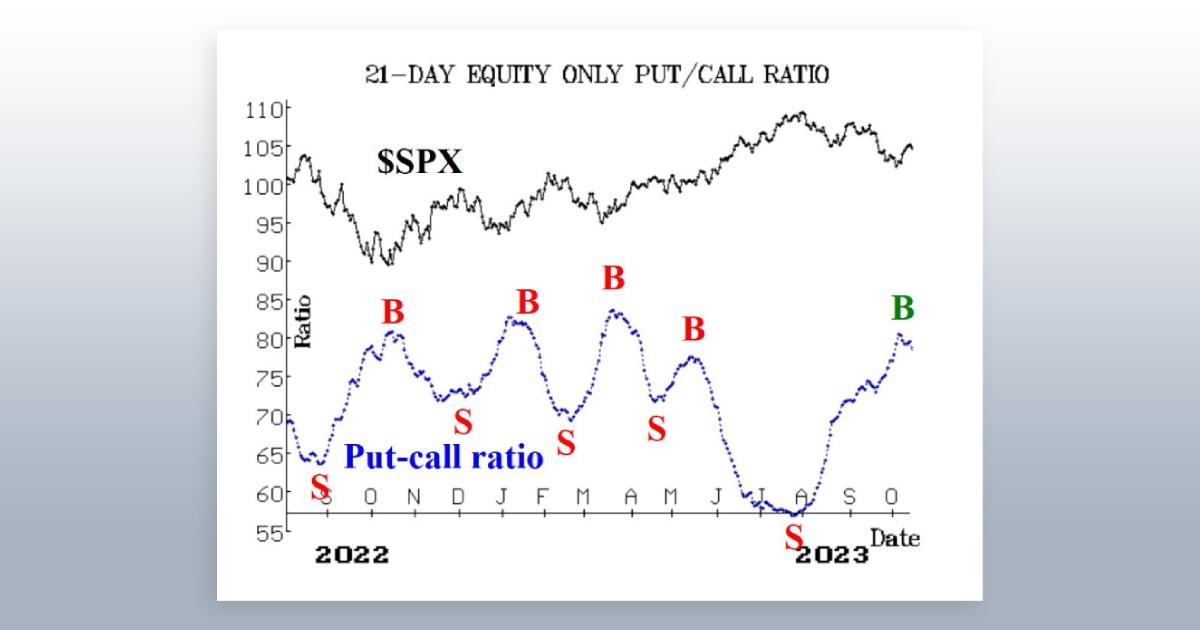
Put-call ratios are useful, sentiment-based, indicators. The put-call ratio is simply the volume of all puts that traded on a given day divided by the volume of calls that traded on that day. The ratio can be calculated for an individual stock, index, or futures underlying contract, or can be aggregated – for example, we often refer to the equity-only put-call ratio, which is the sum of all equity put options divided by all equity call options on any given day. Once the ratios are calculated, a moving average is generally used to smooth them out. We prefer the 21-day moving average for that purpose, although it is certainly acceptable to use moving averages of other lengths.

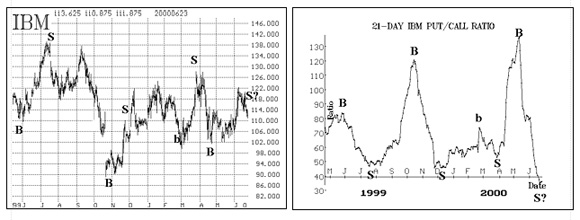
The chart on the right above is a sample one – of IBM. Buy and sell points are marked on the chart. Note that buy signals occur when the ratio is “too high” (i.e., near the top of the chart) and sell signals occur when the ratio is “too low” (near the bottom of the chart). The chart on the left above is that of IBM common stock, with the put-call ratio buy and sell signals marked on it. You can see that, in general, the signals are good ones. In reality, we couple technical analysis – using support and resistance levels – with the signals generated by the put-call ratios. The combining of the two methods normally produces better-timed entry and exit points in our trades.
A dollar-weighted put-call ratio is constructed by using not only the volume of the various options, but their price as well. The two are multiplied together, and the total of that product for all put options is divided by the total of that product for all call options. That computation is the daily weighted put- call ratio. As with the “standard” put-call ratio, this weighted ratio can be computed for individual stocks, futures, or indices, or for aggregated groups of options. Formally stated, the weighted put-call ratio can be written mathematically as shown in the box below. What this weighted ratio attempts to show, which the “standard” ratio does not, is how much money put buyers are spending.

The thinking is that it is more important to know how much total money is being spent on puts versus calls, than merely to know the volume. This point has some validity. For example, a person who is merely hedging his position perhaps is not really all that bearish, but just wants to buy some puts as insurance. He might buy fairly deep out-of-the-money puts. Thus, his dollars would be spent on rather low-priced puts. On the other hand, a truly bearish speculator would most likely buy a put with a higher delta – something that is at-the-money, or perhaps slightly in-the-money. Thus, this “true” bearishness would perhaps result in a higher expenditure in terms of dollars.
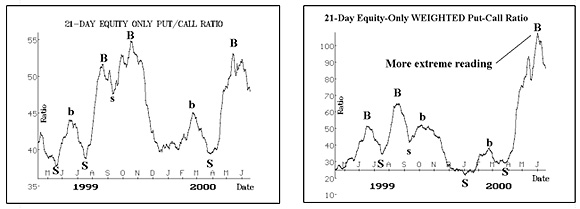
The main difference between the “normal” and weighted ratios is that the weighted put-call ratio generates more extreme readings – especially at major turning points. That is, during bullish periods the weighted reading can dip down to 0.20 or below on a given day, even pushing the 21-day moving average down to those minimal levels at times. The “standard” put-call ratio rarely gets that low, especially where equity options are concerned. Furthermore, during extreme bearishness, the weighted ratio will easily rise above 2.00 on individual days, and the 21-day average can rise to nearly 2.00 as well. Again, those kinds of numbers are generally unheard of for the “standard” ratio.
As an example, let’s look at the big picture, via the equity-only charts. The two charts below show the “normal” ratio (on the left) and the “weighted” ratio (on the right). The buy and sell signals are marked on the charts. For these charts, the major buy and sell signals occur at relatively the same points in time.

For more information on Put-Call Ratios, refer to Larry's book McMillan on Options or Using Put-Call Ratios seminar. Get access to over 200 put-call ratio charts on various stocks, futures and indices by subscribing to The Strategy Zone.
© 2023 The Option Strategist | McMillan Analysis Corporation
