
By Lawrence G. McMillan
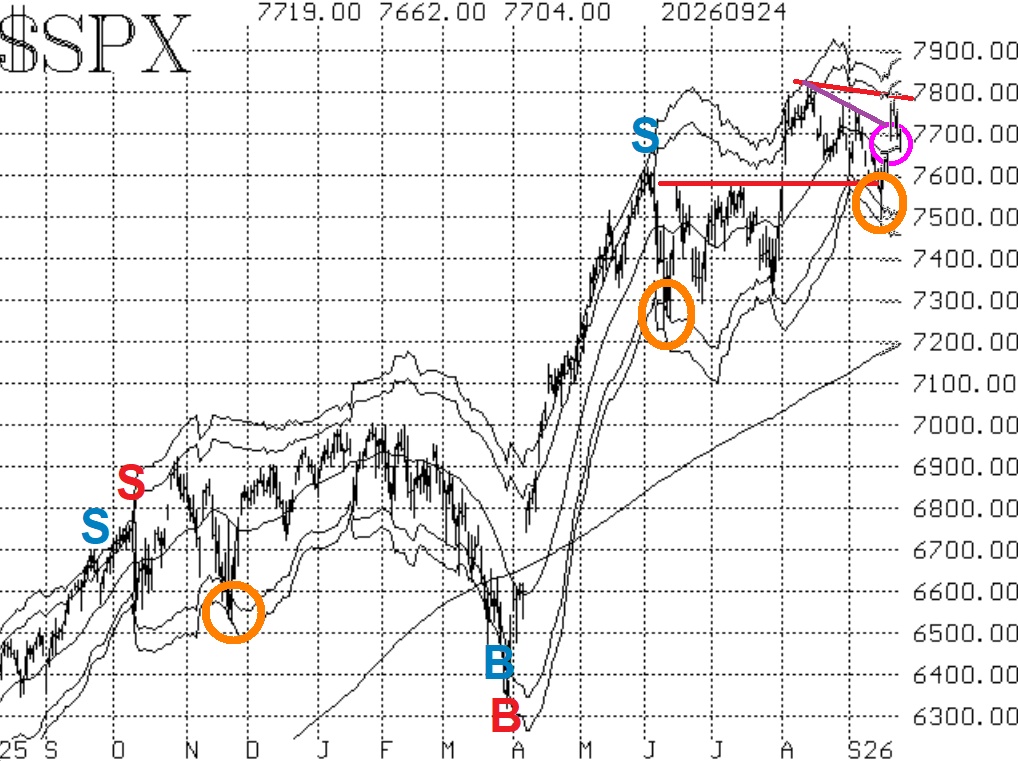
This market continues to be one with a huge split between the technical indicators. The market internals (breadth, put-call ratios, New Highs vs. New Lows) remain in terrible shape. However, the $SPX chart itself has regained a positive stance, with last Monday's gains breaking through the downtrend line that had existed. Moreover, the various indicators surrounding $VIX remain positive.
$SPX broke above the downtrend line on its chart (the purple line in Figure 1) and attempted to reach the all-time highs at 7820. It didn't quite do so and has now fallen back a bit. So there is resistance at 7780-7820. Meanwhile, last Monday's big rally left a gap on the chart (pink circle in Figure 1), and the bottom of that gap is the first support level, 7680. Below that, we know that $SPX had tried to probe down through support in the 7580-7620 area several times (even closing below there for one day), and it bounced each time. So that is a stronger support area.
The only real improvement in the internals has been in the weighted equity-only put-call ratio, which has now turned downward (see Figure 3). According to the computer analysis programs, that is a new buy signal from this indicator. It is not accompanied by an improvement in the standard ratio, though (Figure 2), which remains on a sell signal. Until these two are in agreement we are not taking a position based on the equity-only put-call ratios.
Market breadth has continued to be poor. They are in oversold territory, to be sure, but they won't generate buy signals until they can reverse and gain some positive ground. At this point, it would take at least three days of positive breadth to generate buy signals here. The NYSE breadth oscillator has been more negative than the "stocks only" breadth oscillator.
The various indicators surrounding implied volatility -- $VIX and its products -- have been much more bullish and thus are more in line with the $SPX chart. There are still two buy signals that are operative from the chart of $VIX. Also, the construct of volatility derivatives has remained positive.
So, despite poor market internals, $SPX continues to be relatively positive as it probed for new highs this week. We will continue to trade confirmed signals as they occur and will continue to roll deeply in-the-money options.
This Market Commentary is an abbreviated version of the commentary featured in The Option Strategist Newsletter.

© 2023 The Option Strategist | McMillan Analysis Corporation