By Lawrence G. McMillan
The S&P 500 Index ($SPX) has advanced on ten of the last eleven trading days. Needless to say, the Index chart has strong upward momentum. Media articles continue to focus on how overbought the market is, and how it’s certainly due for a correction. But “overbought does not mean sell.” Once again, we are reminded of John Maynard Keynes’ statement that the market can remain irrational for longer than you can remain solvent. That currently applies mostly to short sellers, but could also be directed towards under-invested institutions and those who have sold some stocks prematurely to raise cash.
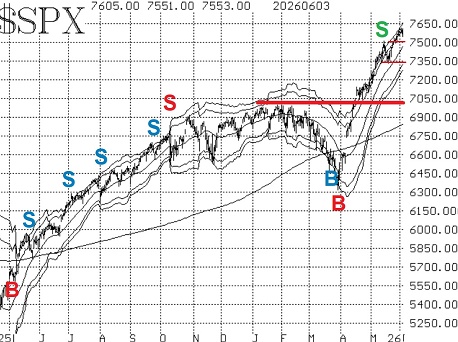
There is tentative support on the $SPX chart at this week’s low of 7516. Below that, the next support area is 7330. At this point a violation of support at 7330 would likely be viewed as quite negative, but there is additional support on down to 7000.
The McMillan Volatility Band (MVB) sell signal remains in place as our only confirmed sell signal at this time. It would be stopped out by an $SPX close above the +4σ “modified Bollinger Band” which continues to race higher.
Both equity-only put-call ratios have fallen to new relative lows, as call buying has been heavy in this rising stock marked. That cancels out their recent attempts at sell signals. For new sell signals to appear here, these ratios would have to turn and begin to trend upward.
Breadth has not been terrific recently, but it has managed to keep hanging in there. The NYSE breadth oscillator remains on a buy signal. The “stocks only” breadth has generated a sell signal, but just barely. We’d prefer to see agreement here before calling it a confirmed signal either way.
Meanwhile cumulative volume breadth (CVB) has recently been strong. As one can see from the yellow rows in the Table on Page 1, CVB made new all-time highs for five days in a row. This is strong confirmation of the recent all-time highs being made by $SPX.
New 52-week Highs on the NYSE have, for the most part, dominated New Lows. There was one day when New Lows had the upper hand, by one issue! But this indicator remains on a buy signal and will continue to do so until New Lows outnumber New Highs for two consecutive days.
$VIX has remained in a tight range – even on the one day when there was some selling. Thus, the trend of $VIX buy signal for stocks remains intact. That will continue to be the case until $VIX closes back above its 200-day Moving Average. $VIX is beginning to get down the area where it normally is when $SPX is making new all-time highs, but it has more to go – perhaps reaching the 14-15 area.
The construct of volatility derivatives remains bullish. The term structures of both the $VIX futures and the Cboe Volatility Indices are sloping upwards – especially in the front end. In addition, the $VIX futures are trading at a large premium to $VIX. Those are all positive signs for stocks.
In summary, the overall picture remains bullish. The $SPX chart is making new all-time highs, and there is only one confirmed sell signal at this time versus several bullish signals that remain in place. We will take bearish positions only when sell signals are confirmed. Meanwhile, continue to roll deeply in-the-money calls upward.
This Market Commentary is an abbreviated version of the commentary featured in The Option Strategist Newsletter.

© 2023 The Option Strategist | McMillan Analysis Corporation