By Lawrence G. McMillan
This market is the epitome of our phrase, "overbought does not mean sell." It just keeps going higher, and now the rally has broadened enough so that the Dow ($DJX; DIA), NASDAQ-100 ($NDX; QQQ) and Russell 2000 ($RUT; IWM) are all doing the same. All of these indices, including $SPX, have made new all- time closing and intraday highs this week.
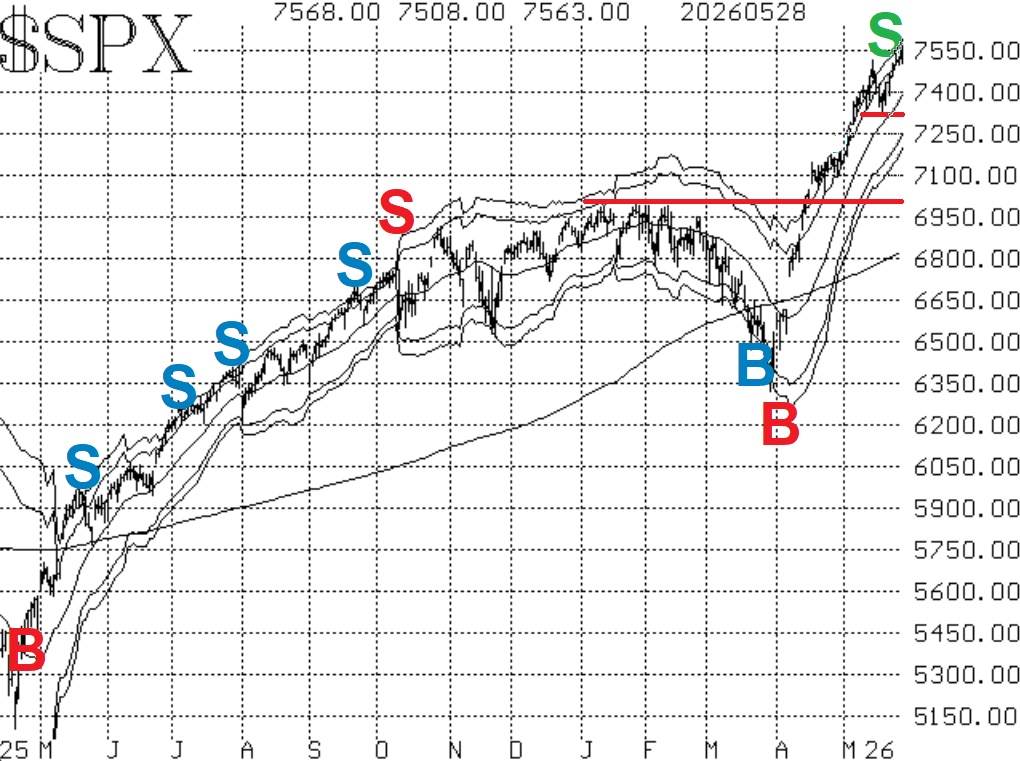
$SPX has support at 7330 -- the lows from earlier this month. Below that there are various support areas: 7275, 7050-7175, and then a major support at 7000.
Equity-only put-call ratios gave sell signals a week ago when they turned upward from very low levels on their charts. Those sell signals were confirmed by both the computer analysis and the naked eye. However, this week call buying has been heavy with the major averages making new all-time highs (as one would expect), and so the standard ratio has fallen to new relative lows -- thus stopping out its sell signal. The weighted ratio continues to hover just above its lows of last week, so it is still technically on a sell signal, although just by a hair.
Market breadth has improved over the past week. Now, the breadth oscillators are on buy signals. This is our shortest-term indicator, and it can whipsaw back and forth quickly. It is also interesting to note that the cumulative breadth indicators are strong as well.
Meanwhile, $VIX has sort of grudgingly begun to fall, and a new trend of $VIX buy signal was confirmed on May 22nd, when $VIX closed below 17 for two consecutive days (circle on the chart in Figure 4). This buy signal will remain in effect until $VIX closes back above its 200-day Moving Average.
So, overall, the picture remains very bullish. Most of our indicators are on buy signals. Continue to take all confirmed signals, and continue to roll deeply in-the-money options.
This Market Commentary is an abbreviated version of the commentary featured in The Option Strategist Newsletter.

© 2023 The Option Strategist | McMillan Analysis Corporation