By Lawrence G. McMillan
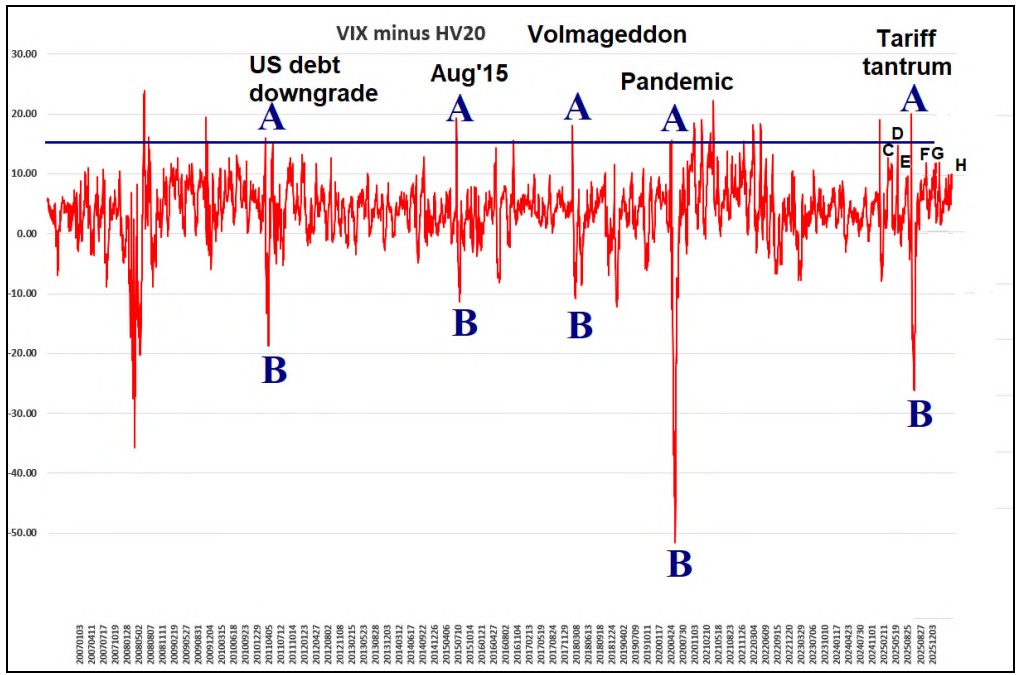
Both in May 2025 and October 2025, we published articles with the above title. I won’t include them here, because they were too long, but one can find them in the archives of The Option Strategist Newsletter on the website. I will, however, summarize them. It turns out that when realized volatility and implied volatility differ by a substantial amount, it can be a market-predicting event. Here’s the quick summary, using the 20-day historical volatility of $SPX (HV20) as realized volatility and $VIX as implied volatility:
- if $VIX minus HV20 is greater than 15 on any day’s close, then an alert has been issued for a major buy signal, which occurs when the differential drops back down to below 10. These tend to be violent buy signals, often short-term in nature, but also may indicate an eventual major bottom.
- if HV20 minus $VIX is greater than 10, a major buy signal is also at hand, when that differential drops back below 10. These tend to be longer-term buy signals, lasting several months at least.
Those are both rare, but powerful. Last year condition (1) occurred in mid-April. It was a harrowing ride, but that was fairly near the bottom of that sharp and drastic selloff. That quickly led to condition (2) occurring in May 2025. We took positions in May 2025, using September 2025 options, because of that signal. They worked out well.
Neither of those is occurring right now, but $VIX has risen more than 10 points above HV20 on a closing basis twice in the past week (and even higher intraday). So, it is worth paying attention now.
When we discussed this topic last October, we noted a further condition: if $VIX exceeds HV20 by at least 12 points, the market tends to get even more volatile after that, although the direction of market movement is unclear. It might be best played with a straddle buy or perhaps even better with a call buy on a volatility product – futures or ETF.
The chart above published in those articles is updated and included at the top of the next page. Point H is the current situation...
Read the full article by subscribing to The Option Strategist Newsletter now. Existing subscribers can access the article here.

© 2023 The Option Strategist | McMillan Analysis Corporation