By Lawrence G. McMillan
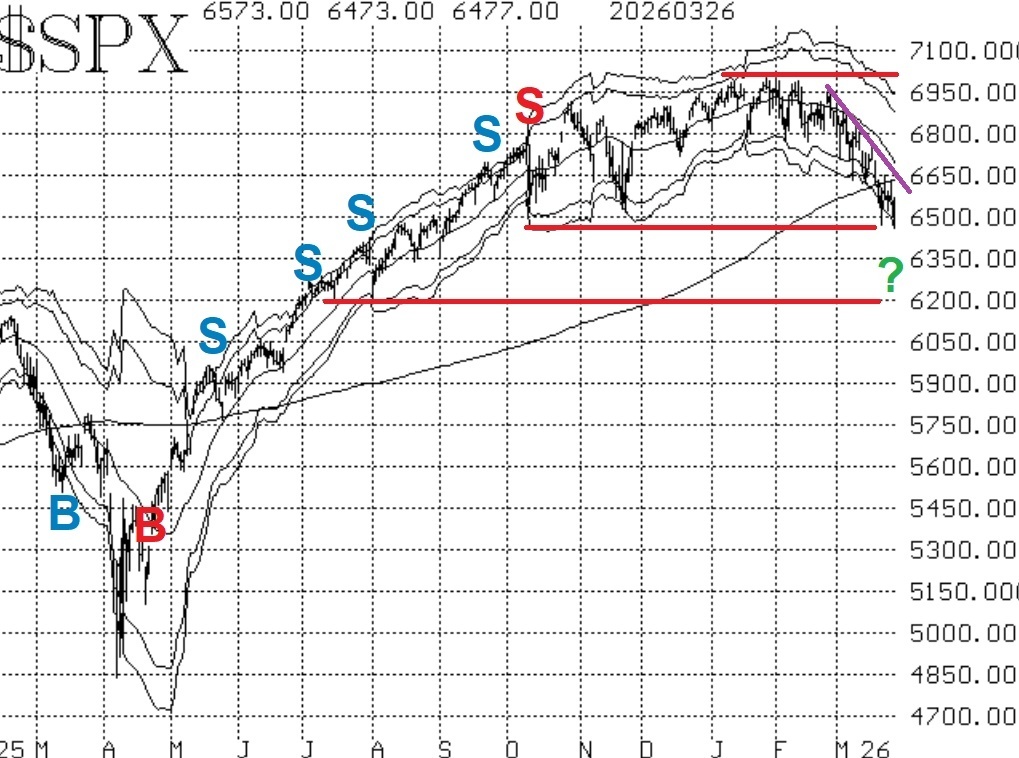
The major averages continue to decline, and they are in a seriously bearish mode. Moreover, the pattern of lower highs and lower lows persists, so there is a distinct downtrend line that can be drawn (see Figure 1, purple line).
The support level at 6500-6550 that had originally been established back in October and November has been tested. But today, we are nearing 6400, so one has to say that support level has been broken. There is potential support near 6200, which was the low of last July and August (see the chart in Figure 1).
Equity-only put-call ratios continue to climb, and that is bearish for stocks. Both ratios made new relative highs yesterday (March 26th) and they are going to remain on sell signals until they roll over and begin to trend lower.
There were a couple of days of strong positive breadth. However, that was not enough to generate buy signals from the breadth oscillators. So, as it stands now, both oscillators are on sell signals but are in oversold territory.
The trend of $VIX sell signal (pink "S" on the chart in Figure 4) remains in place. $VIX would have to close back below its 20- day Moving Average to stop out that sell signal.
The overall picture remains bearish. That basically emanates from the $SPX chart. We would take confirmed buy signals, but none have appeared so far. This may be more than just an oil- driven bear market. In any case, we will follow our indicators, and they are bearish at this time.
This Market Commentary is an abbreviated version of the commentary featured in The Option Strategist Newsletter.

© 2023 The Option Strategist | McMillan Analysis Corporation