By Lawrence G. McMillan
The impetus for this column came from the fact that the S&P futures took a beating last Monday (January 19th, 2026) on the holiday celebrating Martin Luther King. Of course, it was only a partial session (ending at 11am) and did not include any stock trading on the NYSE at all. But the futures were down 89 points intraday and closed down 63. The reason – which is not really important – was the announcement of Greenland-related tariffs, and the market then threw another “tariff tantrum.” I immediately recalled a very similar situation on MLK Day in 2008. That time, S&P futures traded down 70 points (which was the allowed limit in those days) because of the actions of a rogue trader at Societe Generale that threatened the fiscal health of the bank. Stocks were closed for the holiday. That 2008 episode set the tone for a very bad year – and really a very bad 14 months. Yes, the market had peaked the previous October (2007), but that didn’t seem like a very important market decline at the time – until MLK Day’s futures trading.
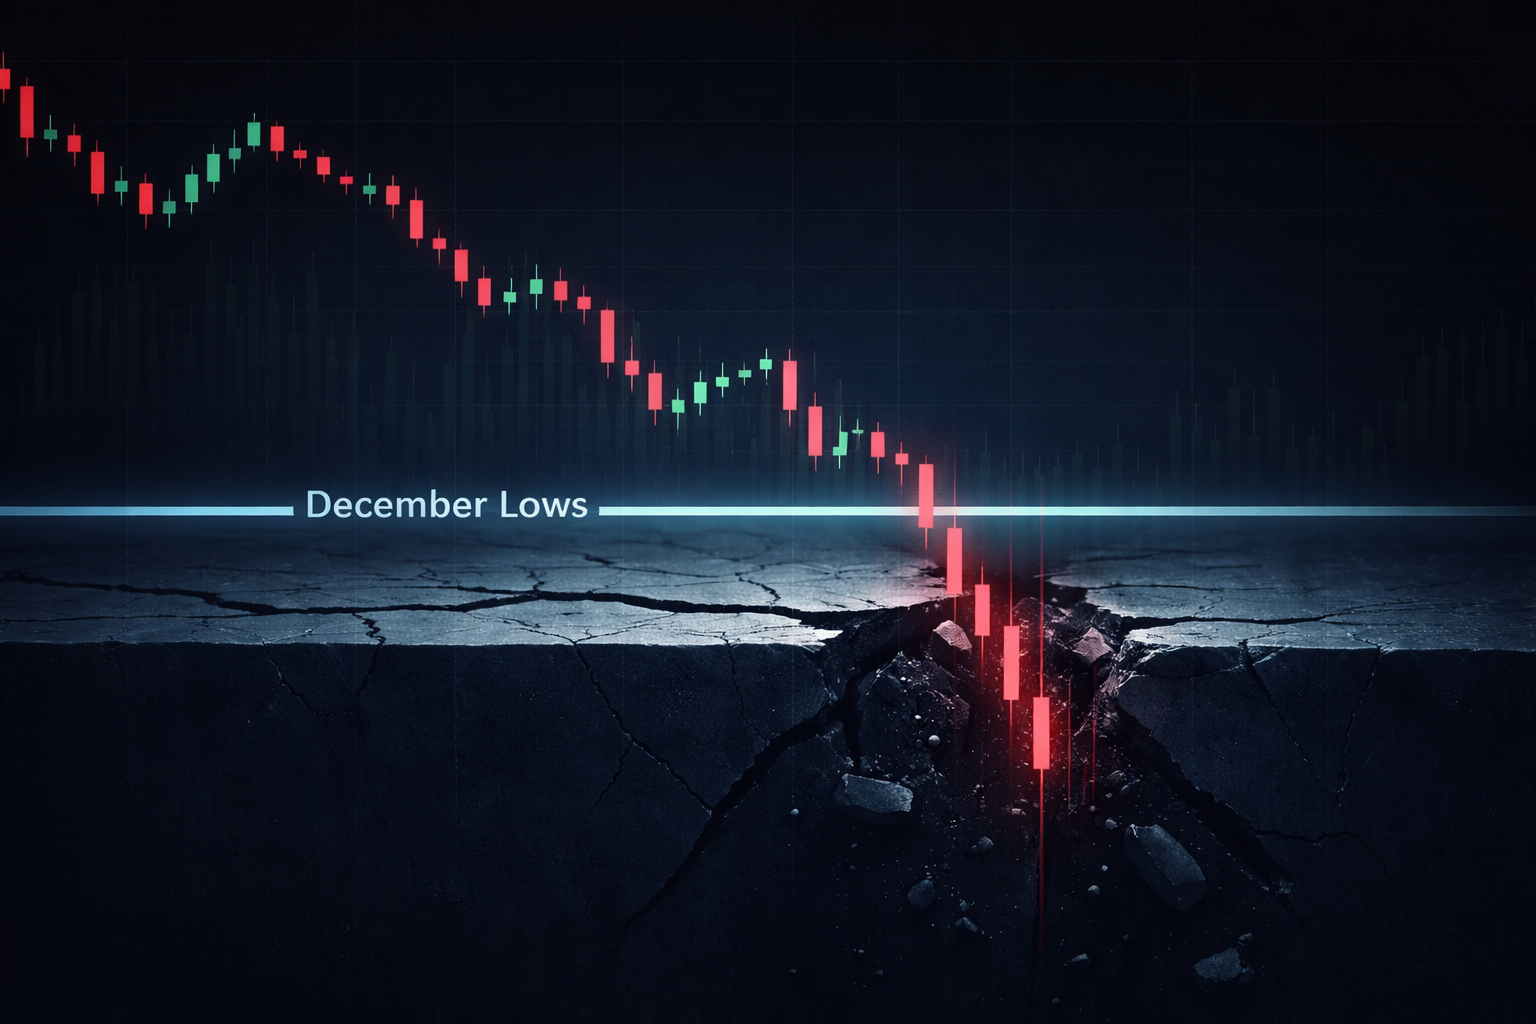
But one (holiday’s) trading doesn’t make a trend, really. What also happened on that day back in 2008 was that the decline followed a breakdown below the lows of the previous December. That is – for me – a very negative sign, especially if it occurs in the early months of the next year.
So, in this article we’re going to take a look at several recent years (since 2008) where that December low was violated early in the following year, on a closing price basis, and see what happened for the rest of the year. We’re also going to bring in the statistics that are in the Stock Market Almanac regarding this phenomenon and give you the Hirsch Organization’s take on things.
The “Base case” – 2007-2008
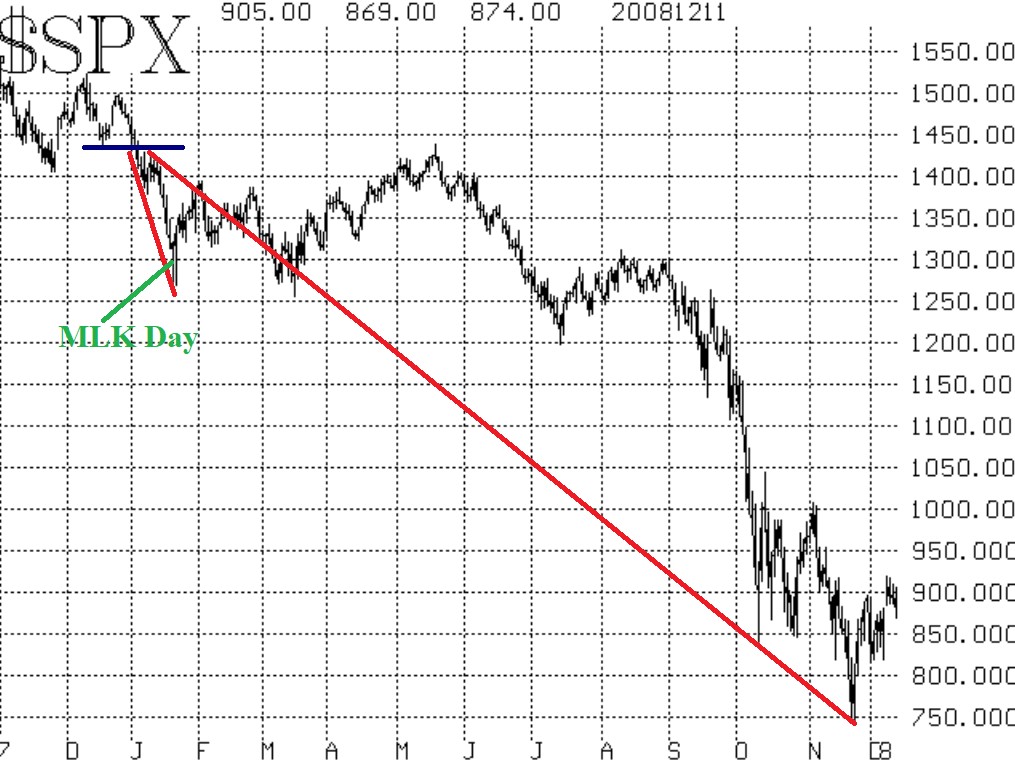
Let’s start with the example from above, when the market broke down on MLK Day of 2008. The horizontal blue line on the accompanying chart shows where the December lows were, at about 1440 for $SPX. Those lows were actually violated early in 2008, well before the MLK holiday. The holiday trading (not shown on this chart, since this shows NYSE trading only), was followed by the bar pointed to by the green line. Both that day and the next, $SPX sold off sharply but recovered. So, the first decline after the December lows were broken was one that ended with the trading just after the MLK holiday. That is the leftmost red line on the chart – a decline of 170 $SPX points, or almost 12%...
Read the full article by subscribing to The Option Strategist Newsletter now. Existing subscribers can access the article here.

© 2023 The Option Strategist | McMillan Analysis Corporation