By Lawrence G. McMillan
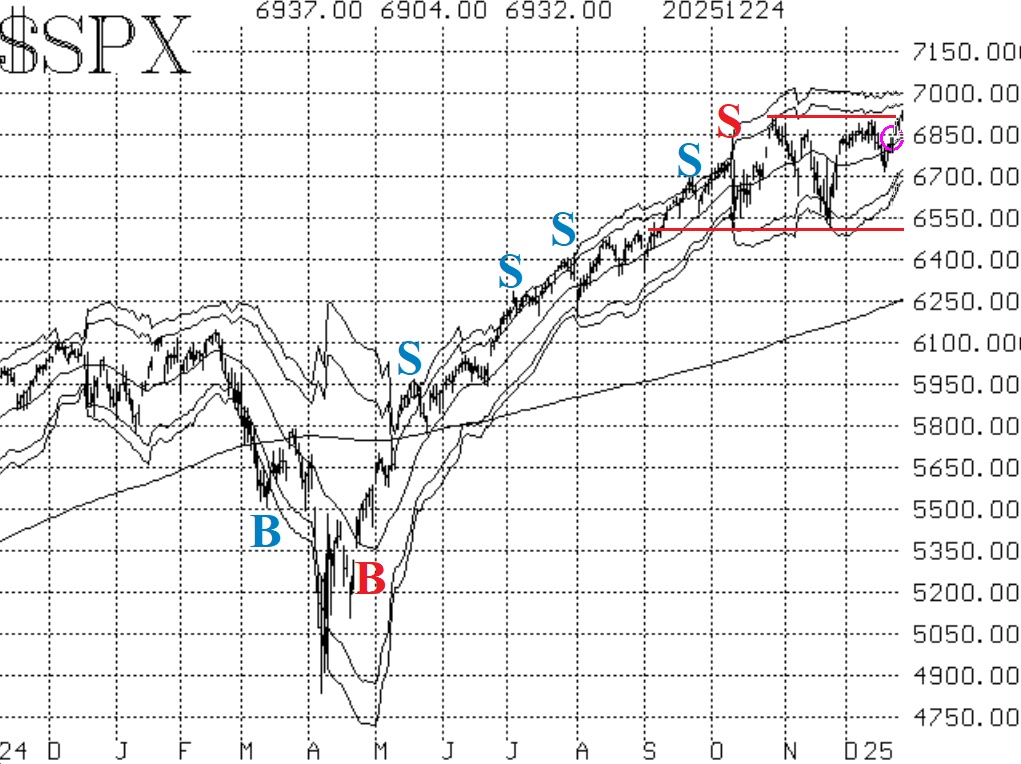
$SPX broke out to new all-time closing and intraday highs this week. This comes as a quick turnaround after some heavy selling just a week ago. A clear breakout would constitute a two-day close above 6920, which can be accomplished as early as today. Once that is in place, the pathway to higher prices should be open. Last week's low was at 6720, so that is a support level. Also, there is a gap on the $SPX chart from this past Monday's strong opening. The lower part of that gap is 6840. so we'll consider that as a tentative support point as well.
Equity-only put-call ratios remain on buy signals. They have been dropping more rapidly over the past week since call buying has picked up considerably. As long as they are declining, that is bullish for the stock market.
Breadth is the only indicator that is not aboard the bullish bandwagon. Standard breadth (the mere difference between advances and declines) has been struggling to maintain consistency. Both buy and sell signals have occurred with some frequency but have been quickly reversed. At the current time, the "stocks only" breadth oscillator is back on a buy signal. However, the NYSE-based breadth oscillator is still on a sell signal.
Implied volatility has dropped. $VIX has now fallen to new lows for 2025 and is at the lowest levels since December 2024. So the two $VIX-related buy signals remain intact. The "spike peak" buy signal and the trend of $VIX buy signal.
Seasonality is bullish through the second trading day of 2026 (Monday, January 5th). We have just now entered the third of three seasonal patterns that occur after Thanksgiving. This one is called the "Santa Claus rally," and it encompasses the last five trading days of one year and the first two trading days of the next year.
So, we now have a tentative agreement between the bullishness of most of our indicators and the chart of $SPX. The fact that $SPX is breaking out to new highs is a positive sign. Once new highs are reached, $SPX should be able to sharply move higher.
This Market Commentary is an abbreviated version of the commentary featured in The Option Strategist Newsletter.

© 2023 The Option Strategist | McMillan Analysis Corporation