By Lawrence G. McMillan
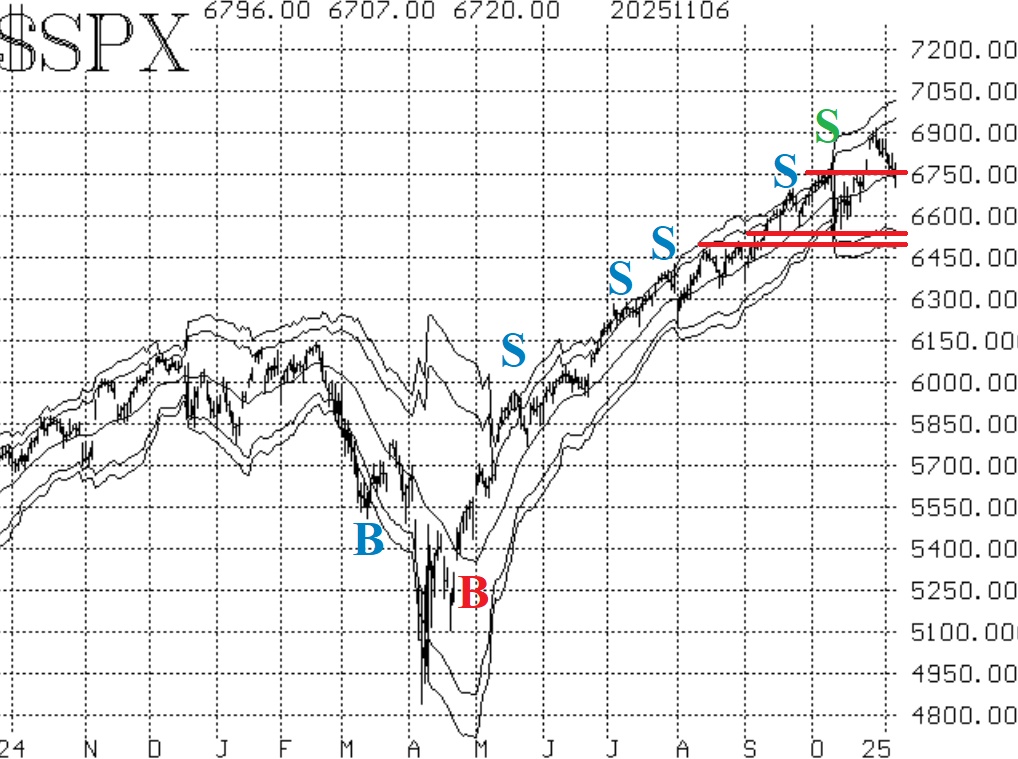
After having gapped to new all-time highs a little more than a week ago, the broad stock market has gone into a modest (so far) corrective mode. $SPX has now closed both of the gaps that were in place from late October, and has closed below the first support level of 6750. This is not a major breakdown of the chart at this point. $SPX has merely pulled back to its rising 20-day moving average. The next support level is the 6500-6550 level that has been tested and held several times. If that were to be broken, then a much more bearish outlook would be in store.
Equity-only put-call ratios continue to rise, so their sell signals (for the stock market) of a couple of weeks ago remain in place. As long as the ratios are rising that is bearish for the stock market.
Breadth has generally been poor since October 28th, and both breadth oscillators remain on sell signals. They both dipped down into oversold territory, so a meaningful improvement in breadth that lasts two or three days could generate a buy signal. For now, though, they remain in a bearish state, and they can stay oversold while the market declines.
What have remained bullish are the indicators associated with $VIX and implied volatility. That is beginning to change, though, as these indicators are weakening. A $VIX close above its 200-day Moving Average at 19.40 for two consecutive days will be another sell signal for the market.
So, things are beginning to take on a less positive tone. The bull market is still intact as long as $SPX is above 6500, but there a several sell signals have been confirmed, and we have taken positions in line with those as well. Continue to roll deeply in-the-money positions.
This Market Commentary is an abbreviated version of the commentary featured in The Option Strategist Newsletter.

© 2023 The Option Strategist | McMillan Analysis Corporation