By Lawrence G. McMillan
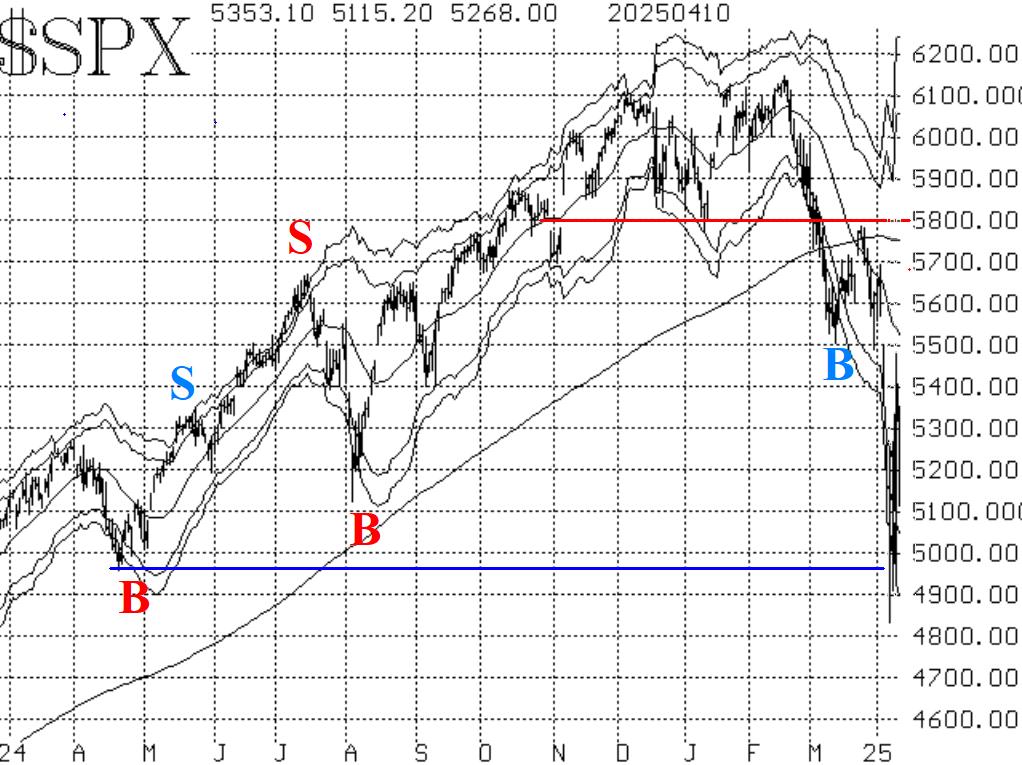
Wildly volatile markets have dominated the scene since last Friday. These are interesting times, but filled with traps. $SPX traded all the way down to 4900, eventually bottoming in that general area on three consecutive days, April 7th to 9th. That roughly corresponds to support from April 2024, which was the end of a mild correction at that time. This time, though, action was much more intense. Eventually, positive tariff news was released and the market exploded to the upside in a massive rally that was one of the largest up days in history, on April 9th. That alone does not make a bottom, though. In the past, the largest up days have come in the midst of very negative markets October and November 2008 (Financial Crisis), for example. Eventually that market went to new lows.
So, there is no reason yet to classify this as anything more than another oversold rally. Those tend to reach the declining 20-day moving average, and perhaps overshoot that by a small amount. Currently, that MA is at 5540 and declining. On an overshoot, there is further overhead resistance in the form of the now-declining 200- day moving average, which is near 5750. If $SPX were somehow to climb above 5800, that would be very bullish, and would probably dictate a change of trend.
Equity-only put-call ratios climbed to new relative highs, thus remaining on sell signals. Once again, the standard ratio seems to be the more persistent one. The weighted ratio has already come off its high for one day, but we need to see both of these roll over and begin to trend lower in order to say that buy signals have been generated by this strong contrary indicator.
Breadth was crushingly bad during the decline, and the breadth oscillators remain mired on sell signals in deeply oversold territory. Even the one strong day of positive breadth (which was a "90% up day") didn't help. It's going to take at least a couple more days of positive breadth to generate buy signals here.
$VIX shot up above 60 on April 7th and probed into the high 50's on the succeeding three days. A new "spike peak" buy signal was generated on April 7th. It will remain in place for 22 trading days, unless it is stopped out by $VIX closing above 60.13 (its most recent peak). This is the only new confirmed buy signal right now.
At the same time, the trend of $VIX sell signal is in place. Positions in line with that sell signal have been rolled down several times in the last week. The upward trend in $VIX is bearish, and this sell signal would only be stopped out if $VIX were to close below its 200-day Moving Average for two consecutive days. That 200-day MA is at about 19.50 now, so that stop is far away from current prices.
In summary, the bears are still in charge even if wounded by the massive oversold rally. New buy signals might change that, but they have not been confirmed yet. Most importantly, continue to roll deeply in-the-money options for credits.
This Market Commentary is an abbreviated version of the commentary featured in The Option Strategist Newsletter.

© 2023 The Option Strategist | McMillan Analysis Corporation