By Lawrence G. McMillan
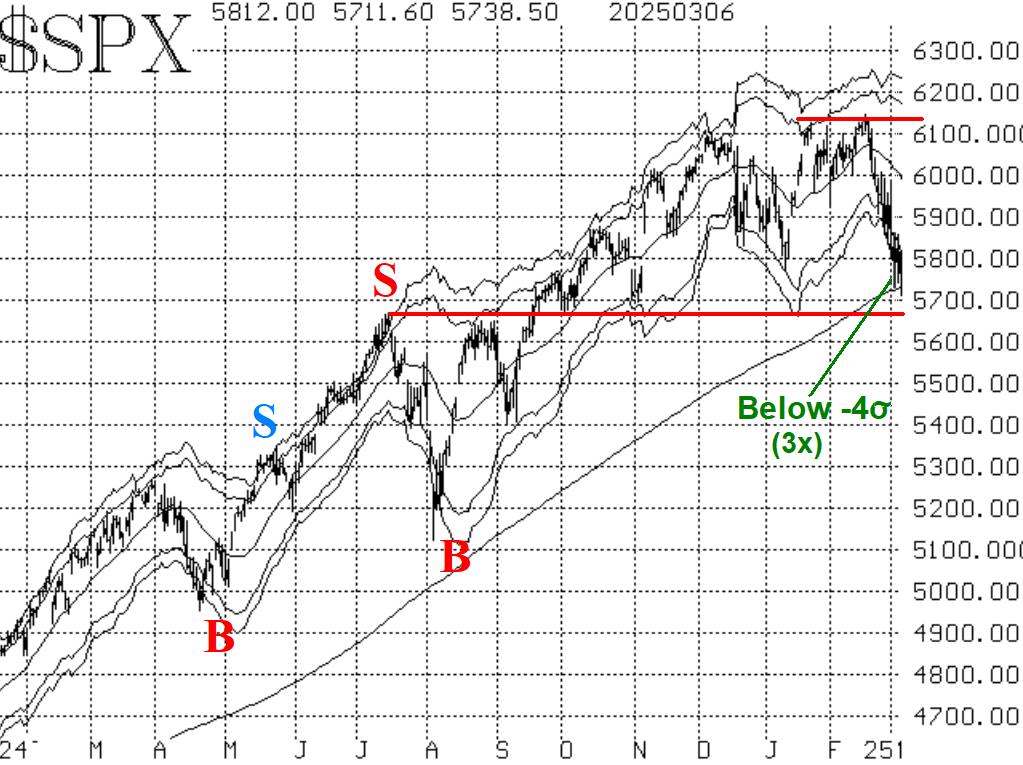
The speed of the market descent from the highs of February 20th to the lows (so far) of March 6th has been swift. The lower end of the trading range had been between 5770 and 5870, but that has been breached this week. There is a support area at 5670, which dates all the way back to last summer (July). It is the lower horizontal line on the chart in Figure 1.
The large market decline over the past two weeks has generated some extreme oversold conditions, Typically, any oversold rallies die out at about the level of the declining 20-day Moving Average. That is currently at 6000 and declining.
Equity-only put-call ratios have continued to rise strongly while the stock market was getting mauled, as one might expect. Both ratios are moving solidly higher and thus remain on sell signals for stocks.
Breadth has been mostly terrible since Feb 19th, just before the false breakout. The breadth oscillators have been on sell signals, and they remain in place. Still, the oscillators are in oversold territory, and two days of positive breadth would generate buy signals from these levels.
$VIX is in an uptrend, and that is bearish for stocks. The trend of $VIX sell signal remains in place. It began within the circled area on the chart in Figure 4, when the 20-day Moving Average of $VIX crossed above the 200-day and began to accelerate upwards.
So, there is a lot of information flowing right now, and much of it is relevant to our trading systems. We will attempt to trade confirmed signals as they occur. It is also important especially in this market to roll deeply in-the-money positions to take partial profits and to reduce reversal risk.
This Market Commentary is an abbreviated version of the commentary featured in The Option Strategist Newsletter.

© 2023 The Option Strategist | McMillan Analysis Corporation