By Lawrence G. McMillan
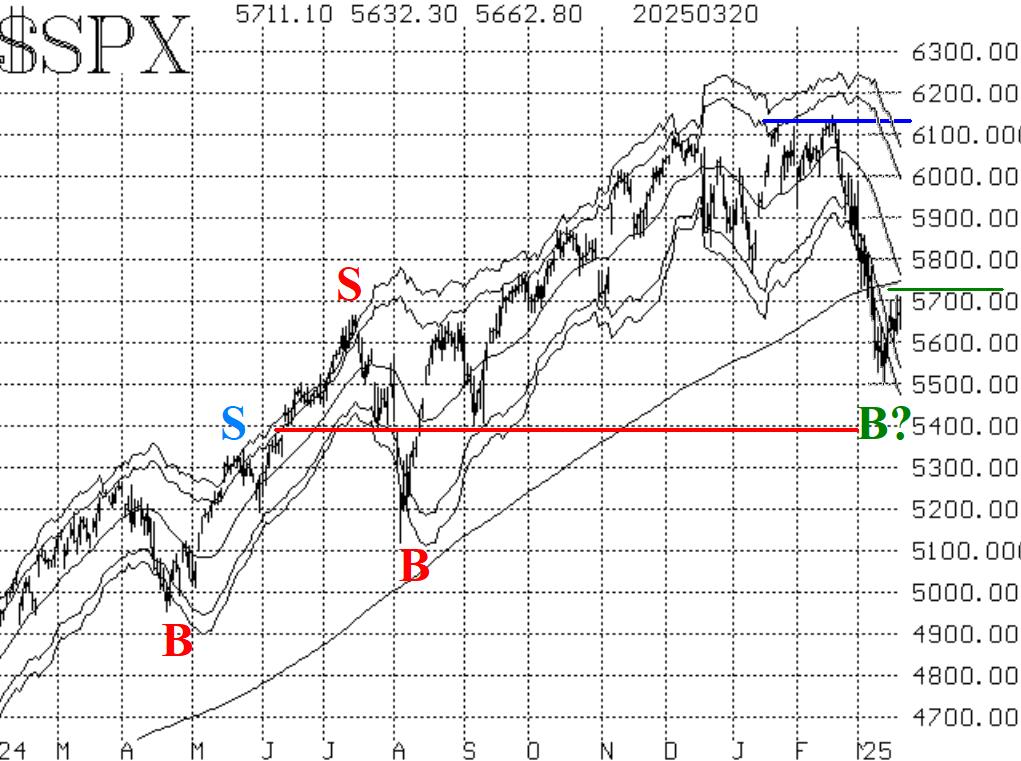
The stock market, as measured by $SPX, has tried to rally over the past week, with a couple of strong days to show for it. But resistance at or just above 5700 has proven to be strong, and so the rally has been repelled from that level. Oversold rallies typically reach and slightly exceed their declining 20-day moving averages. In this case, that moving average is at 5760 and falling rapidly. It looks more like the moving average will fall to meet $SPX, rather than $SPX rallying to meet the moving average.
There is a tentative support level in the 5500-5540 area, which is where there were daily lows a week ago. Below that, there should be support near 5400, which was support last September.
Overall, it seems to me that this rally has been disappointing. In the past, oversold rallies sometimes easily crossed over the 20- day MA quickly and held there for a while before succumbing to selling pressure once again.
Equity-only put-call ratios remain on sell signals, as they continue to rise -- even on days when $SPX rallies. The weighted ratio has reached heights last seen at the end of the 10% market correction in October 2023. It is clearly representing an oversold condition for stocks. The standard ratio is also rising rapidly but has not reached those extremes yet. In any case, these won't generate buy signals until they roll over and begin to decline.
Breadth has been all over the place. Large net plus or minus figures have been recorded almost every day. The net effect of this so far is that the breadth oscillators are on buy signals (because they rose out of oversold conditions), but they don't seem to be doing much with it.
Implied volatility, on the other hand, is giving mixed signals. $VIX ran sharply higher in early March, but has backed off since. That created a "spike peak" buy signal on March 12th, which is still in place. It will remain intact for 22 trading days, unless it is stopped out by a $VIX close above the most recent peak, at 29.57. Meanwhile, the trend of $VIX sell signal was generated back in late February (circle on the $VIX chart in Figure 4), and that remains in place as well since both $VIX and its 20-day MA are above the 200-day MA (which is just above 17).
In summary, the market is oversold and is trying to rally, but it's not gaining much traction. In a typical bear market, these oversold conditions are worked off and sell signals resume. We'll just have to wait and see on that. Meanwhile, we will continue to trade confirmed signals and will roll deeply in-the-money options.
This Market Commentary is an abbreviated version of the commentary featured in The Option Strategist Newsletter.

© 2023 The Option Strategist | McMillan Analysis Corporation