By Lawrence G. McMillan
The McMillan Volatility Bands (MVB) indicator for TradingView is a powerful tool that plots 3- and 4-standard deviation bands around a 20-day moving average, helping traders identify extreme price movements. The indicator includes built-in buy and sell signals based on a system used by Lawrence McMillan in The Daily Strategist newsletter. By waiting for price confirmation before entry, the system helps filter out less-reliable trade setups.
To complement this, the McMillan Volatility Bands Signal Scanner provides traders with a daily email featuring the latest MVB buy and sell signals from a carefully selected list of tradable assets. This curated list includes liquid futures, cryptocurrencies, and stocks/ETFs with high options volume—assets that historically respond well to directional trading strategies. All MVB subscriptions include access to the Signal Scanner, though it is not available for standalone purchase.
Today's Equity Short Candidates
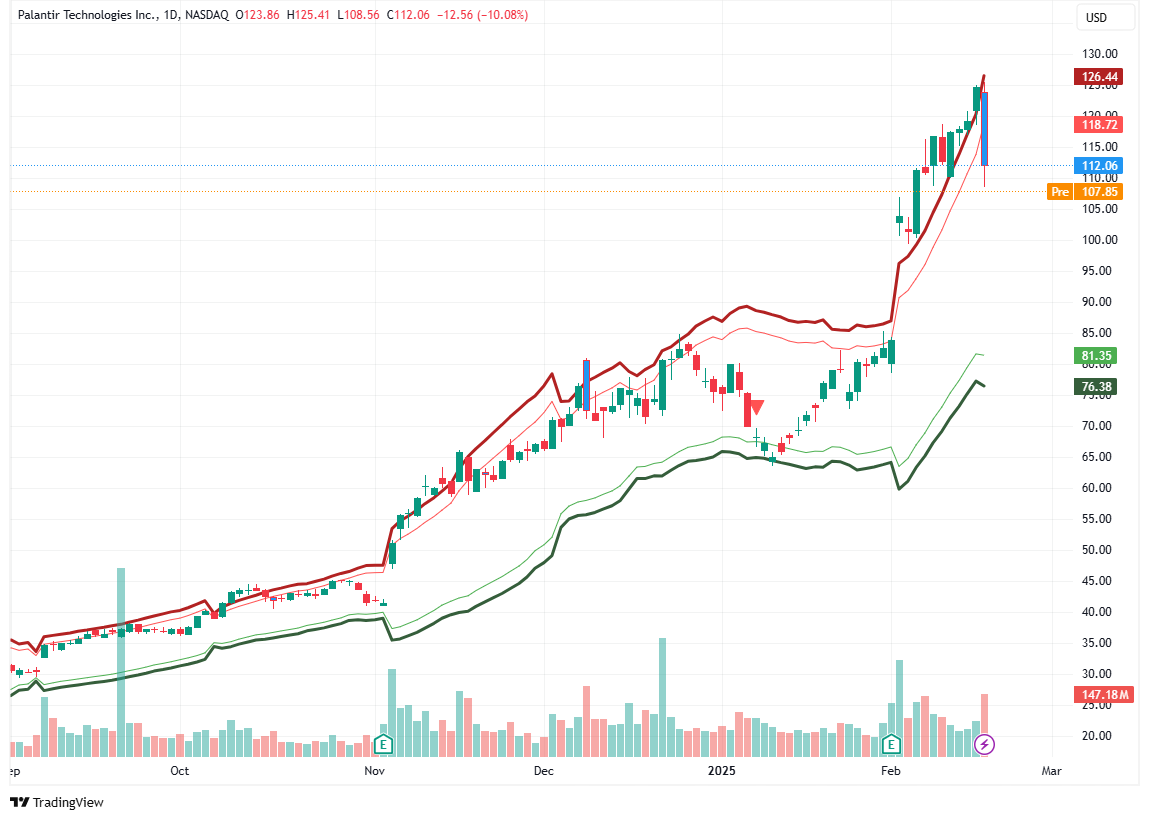
One of the key advantages of using the MVB Signal Scanner is its ability to highlight high-probability trade setups. Today’s scan identified the following stocks as short candidates based on their price action relative to the 3- and 4-sigma bands:
These signals align with McMillan’s well-established trading methodology, giving traders an objective framework to identify and execute potential short trades.
If you’re looking for a systematic way to track volatility-based trade signals, McMillan Volatility Bands and Signal Scanner offer a robust solution. Stay ahead of the market by leveraging these tools to identify opportunities as they arise.
Click here to learn more about McMillan Volatility Bands Buy/Sell Signals.
© 2023 The Option Strategist | McMillan Analysis Corporation