By Lawrence G. McMillan
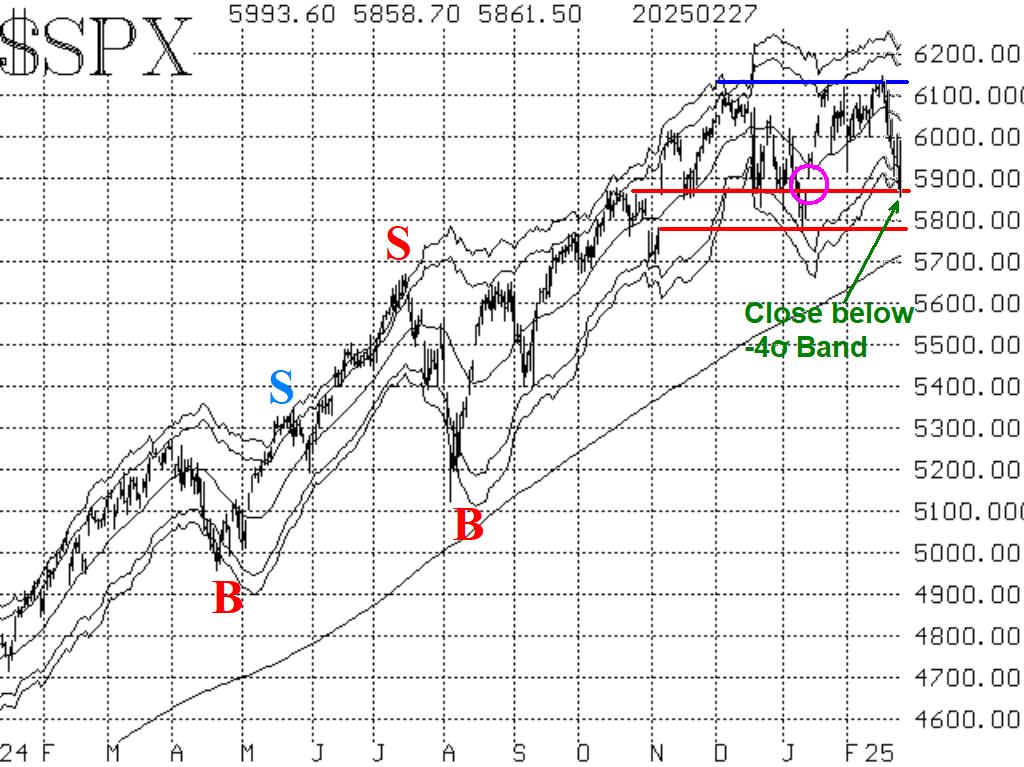
The stock market has quickly retraced the entire trading range after yet another false upside breakout. From there, it has worked its way down the lower end of the range. Yesterday's action closed the gap at 5870 on the $SPX chart (circle in Figure 1). The support levels from 5770 to 5860 are now being tested. There was a false downside breakout back in early January. It would be particularly obnoxious of $SPX if it were to engineer another one of those!
Equity-only put-call ratios remain on sell signals. They have been rising all week, and that continues to be bearish for stocks. These sell signals are relatively recent, and they emanated from the lower areas of the chart -- that is, from an overbought state for the stock market. These normally would prove to be strong sell signals from these levels, so they may have quite a bit more distance to run on the upside.
Market breadth has been terrible, especially in "stocks only" terms. That breadth oscillator remains on a sell signal. The NYSE breadth oscillator is also on a sell signal, but NYSE breadth has been stronger than "stocks only" breadth for about two weeks.
$VIX has not gotten too excited about $SPX falling back into the trading range, but it has gone back into "spiking mode." That could lead to a "spike peak" buy signal soon. Offsetting that, though, is the fact that $VIX is now trending higher.
So, we will be trading some of these new signals, but we are not carrying a "core" position at this time, as long as $SPX remains in the trading range.
This Market Commentary is an abbreviated version of the commentary featured in The Option Strategist Newsletter.

© 2023 The Option Strategist | McMillan Analysis Corporation