By Lawrence G. McMillan
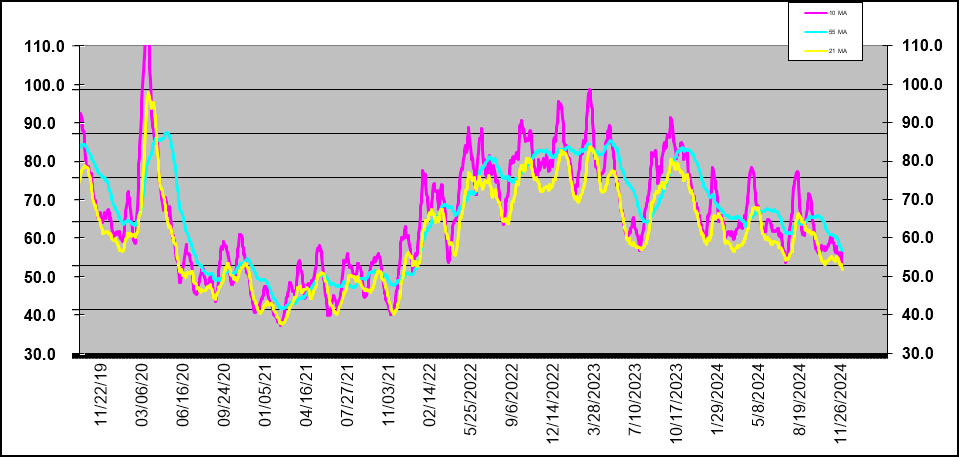
We have addressed this subject a few times in the past, but with the equity-only put-call ratios plunging to multi-year lows, it seems appropriate to take a fresh look and review what we know from the past. As noted in the market commentary above, the standard ratio is down to levels last seen in November 2021. The weighted ratio is at a new low for this year, which is about as low as it ever gets.
The graph above shows the standard equity-only put-call ratio going back to 2014. We have the data back about 27 years, but that far back is more like comparing apples to oranges. When the roaring bull market of the 1990's ended, there was a general increase in put buying among institutions who were employing put purchases for protection. Thus, what had been a “normal” equity-only put-call ratio of, say, 40 to 60 back then, is now more in the range of 50 to 80 (although the standard ratio did dip back into the 40's in the last bull market, which ended in 2021). This is the primary reason that we use the direction of the ratio as the indicator with local maxima and minima giving buy and sell signals, respectively – rather than trying to say that a certain level is a buy or sell signal...
Read the full article by subscribing to The Option Strategist Newsletter now. Existing subscribers can access the article here.
© 2023 The Option Strategist | McMillan Analysis Corporation

