By Lawrence G. McMillan
The broad market continues to be strong, as most of the major indices are trading at new all-time highs now. This includes $SPX, $NDX, $DJX (the Dow), but not $RUT (the Russell 2000). As $SPX has pushed forward, many of our indicators have moved into overbought territory. However, few have confirmed sell signals.
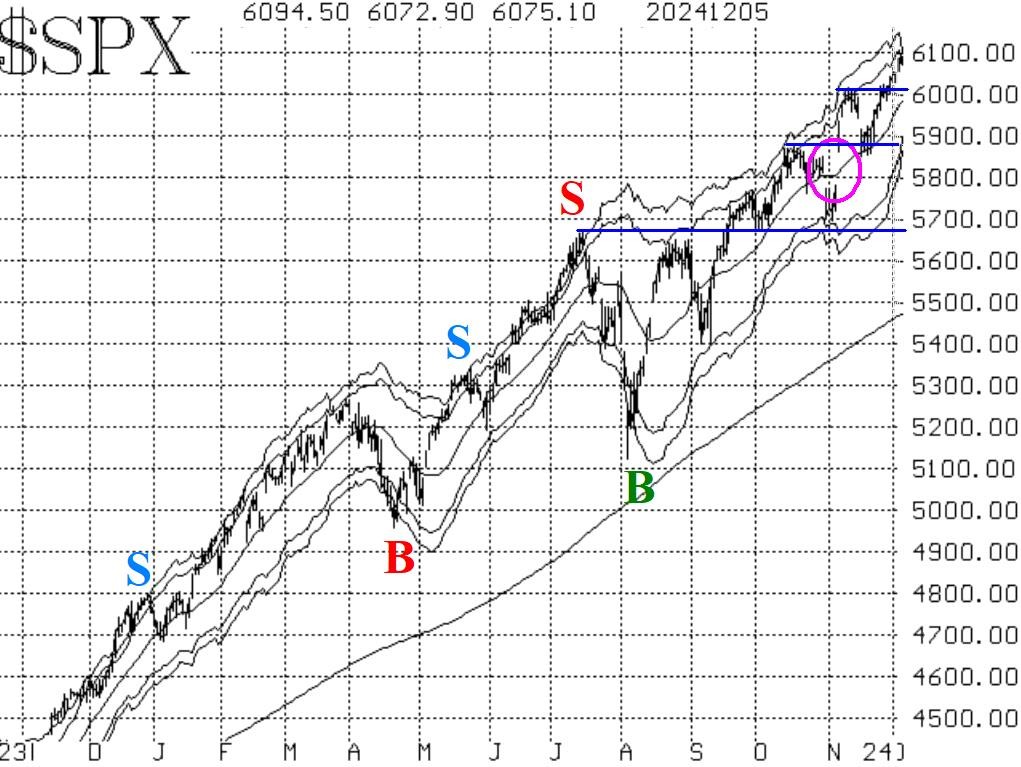
There is support at 6010+ on the $SPX chart -- which was the early November high. Below that, there is strong support at 5870, which has been tested. Then, continuing lower, there is the island reversal (circled on the chart in Figure 1), which remains a bullish influence for the market. Finally, there is the longer-term support at 5670. All of these support areas are marked with horizontal lines on the chart in Figure 1.
Equity-only put-call ratios have plunged to new multi-year lows. So, these ratios will remain bullish now until they roll over and begin to trend higher.
Market breadth has been poor, and is on the verge of generating a sell signal (which would be the first confirmed sell signal from our indicators, if it occurs).
$VIX has drifted down to its lowest levels since last July. This is another overbought condition. The "spike peak" buy signal that was issued on November 6th is about to "expire."
There has been a trend of $VIX buy signal. On December 2nd, These buy signals are terminated when $VIX rises back above the 200-day MA for two consecutive days.
In summary, we are continuing to maintain a "core" bullish position and will do so as long as $SPX closes above 5870. There are a number of overbought indicators, but "overbought does not mean sell." We require a confirmed signal before taking a position. We will add new positions as signals are confirmed. Continue to roll deeply in-the-money calls up.
This Market Commentary is an abbreviated version of the commentary featured in The Option Strategist Newsletter.
© 2023 The Option Strategist | McMillan Analysis Corporation

