By Lawrence G. McMillan
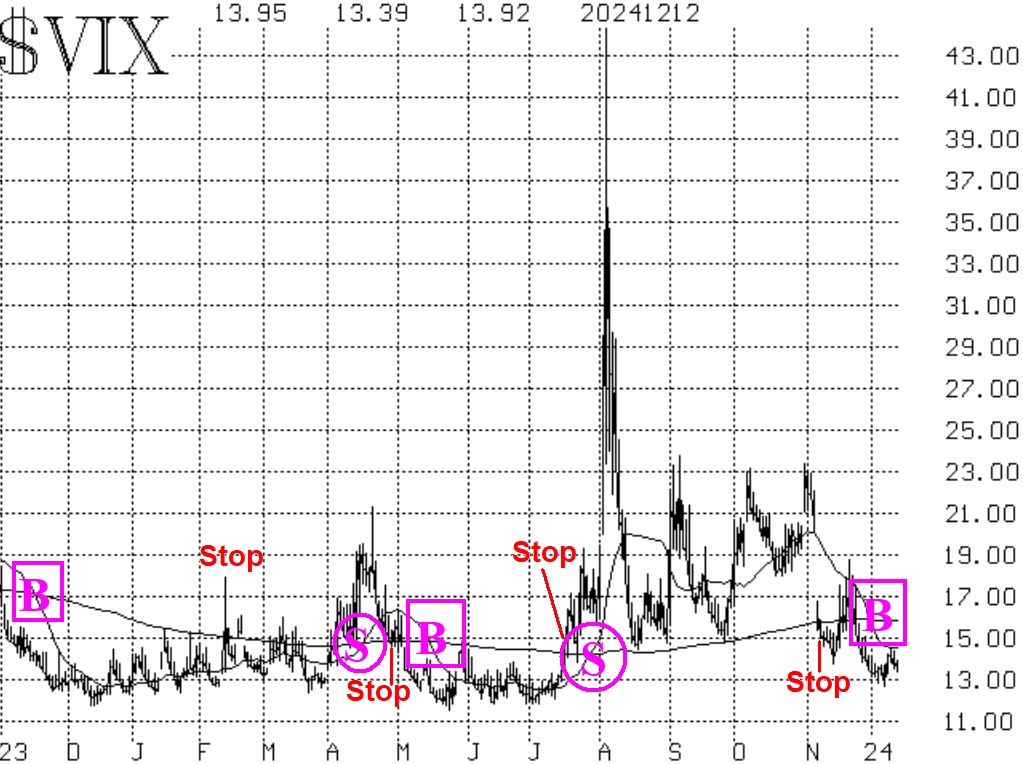
The new trend of $VIX buy signal is the third one in the last year. The $VIX chart from Figure 4 is reproduced here, without the “spike peak” buy signals, so we can discuss these trend of $VIX signals.
First some background: a trend of $VIX buy signal occurs on the first day when both the 20-day Moving Average of $VIX and $VIX itself are below the 200-day Moving Average. Conversely, on the first day that they are both above the 200-day MA, that is a sell signal.
On the accompanying chart there are three buy signals and two sell signals. Buy signals are marked with boxes, while sell signals are denoted by circles. Now, at low levels $VIX itself might not be trending lower per se while it’s on a trend of $VIX buy signal (although at higher prices, it normally is), but the stock market – which generally moves in the opposite direction to $VIX – does normally trend while $VIX is in this state.
These signals are normally stopped out before they reverse. Consider the first buy signal on the left-hand side of the chart. That occurred in late November 2023....
Read the full article by subscribing to The Option Strategist Newsletter now. Existing subscribers can access the article here.
© 2023 The Option Strategist | McMillan Analysis Corporation

