By Lawrence G. McMillan
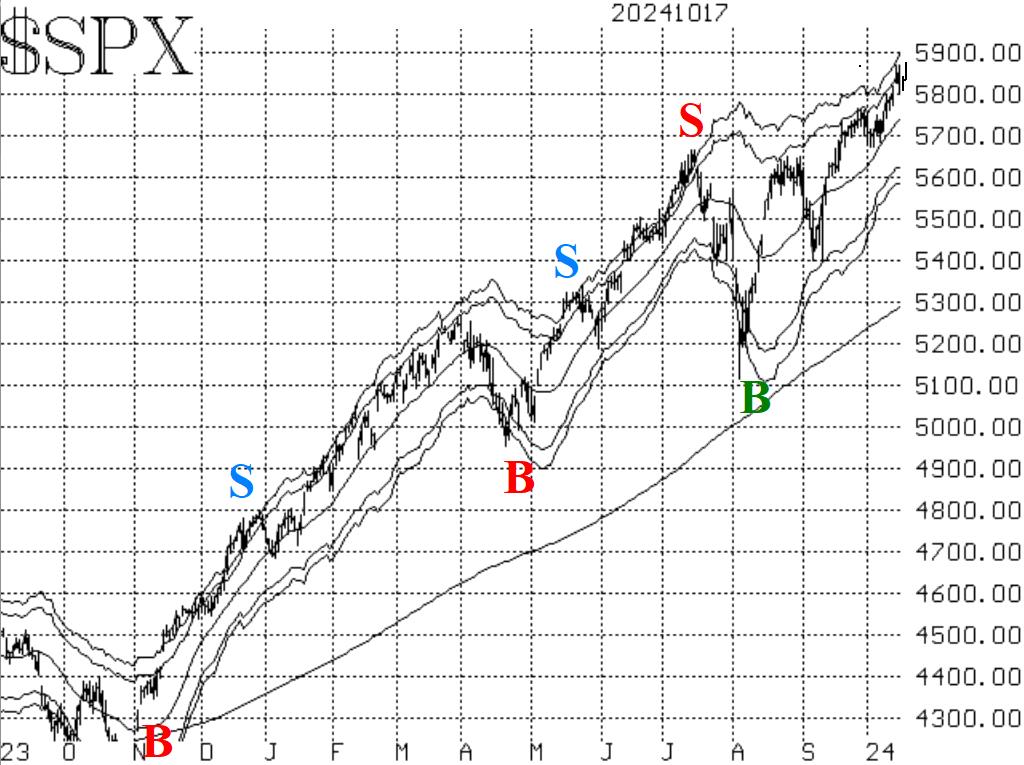
The stock market, as measured by the S&P 500 Index ($SPX) continues to make new all-time highs. The market internals have generally improved as well, thereby giving positive confirmation of those new highs. There is support in the 5670-5770 area.
Since there is no formal resistance when the Index is at new all-time highs, we use the +4å "modified Bollinger Band" (mBB) as a target. That Band is currently just below 5900. $SPX nearly touched the Band a couple of days ago, but didn't quite reach it.
Equity-only put-call ratios remain bullish as they continue to decline. Since they are very low on their charts, they are in overbought territory. But they won't generate sell signals until they reverse upward and begin to trend higher.
Breadth has generally improved, and both breadth oscillators are back on buy signals, in modestly overbought territory. Cumulative Volume Breadth (CVB) has closed at a new all-time high on three of the last four days. That is strong confirmation of the new highs by $SPX.
$VIX continues to remain between two important levels, and thus continues to have two opposing signals at work simultaneously. The "spike peak" buy signal was confirmed as of October 14th, and it will remain in place for 22 trading days, unless $VIX closes above 23.14 (which would stop out the buy signal). Meanwhile, the trend of $VIX sell signal also remains in place since $VIX continues to close above its 200-day Moving Average (currently at about 15.40 and rising).
In summary, we are maintaining a "core" bullish position as long as $SPX continues to close above 5670. We are rolling deeply in-the-money calls upward. Finally, we will trade any new confirmed signals that occur.
This Market Commentary is an abbreviated version of the commentary featured in The Option Strategist Newsletter.
© 2023 The Option Strategist | McMillan Analysis Corporation

