By Lawrence G. McMillan
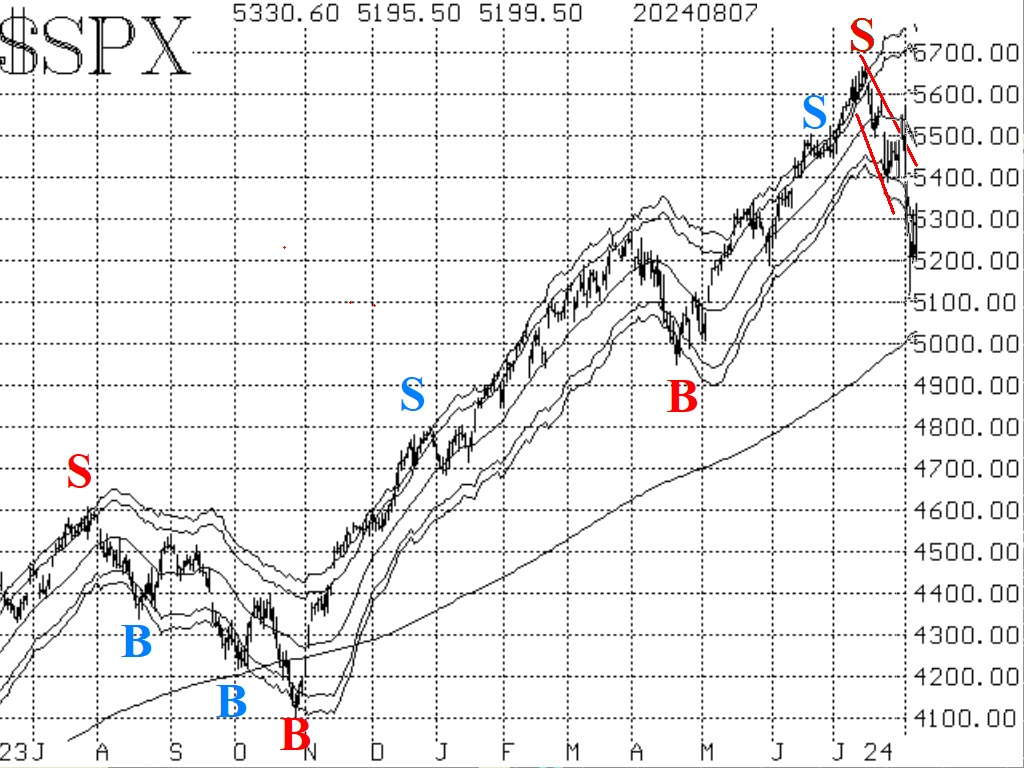
The market broke down badly once the support at area at 5370 gave way. It eventually became oversold, and is still trying to sustain an oversold rally. Typically, oversold rallies carry up to the declining 20-day Moving Average, or perhaps just a little higher before turning downward once again. That could occur just below the 5400 level. There is also a gap on the $SPX chart which would be filled at 5410, so 5400-5410 is about where the extent of this oversold rally should reach.
Equity-only put-call ratios continue to rise sharply, and thus they remain bearish for the stock market. These sell signals will remain in effect until the ratios roll over and begin to decline. The weighted ratio is rising much more quickly than the standard ratio, but neither would be considered oversold at this point on their chart.
Both breadth oscillators are on buy signals as of last night's (August 8th) close. The NYSE oscillator has been the stronger of the two, and it has already confirmed this buy signal for two days. The "stocks only" breadth oscillator needs to hold in buy territory today in order to confirm with a 2-day close there.
Implied volatility ($VIX) is trying to generate some bullish data, and in fact the $VIX "spike peak" buy signal was the first confirmed buy signal that we had from our indicators.
Countering that is the fact that a trend of $VIX sell signal (for stocks) has occurred. That sell signal will remain in effect as long as $VIX is above its 200-day Moving Average.
So, several things are happening all at once. We still view this as a bearish environment, but this oversold rally could attempt to reach 5400 or so on the $SPX chart.
This Market Commentary is an abbreviated version of the commentary featured in The Option Strategist Newsletter.
© 2023 The Option Strategist | McMillan Analysis Corporation

